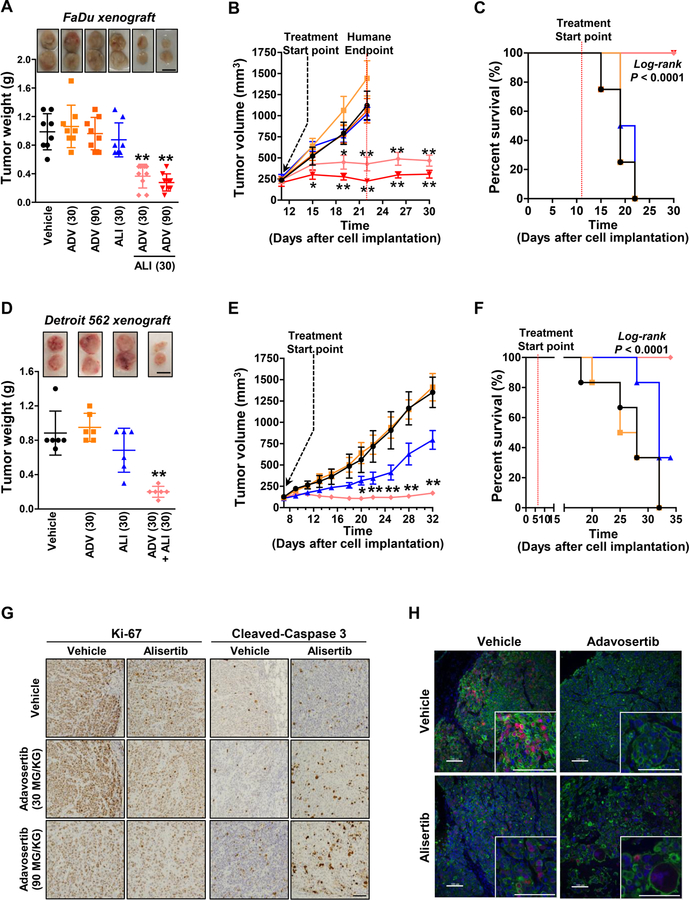
Figure 5. Co-inhibition of AURKA and WEE1 enhances the antitumor efficacy and extends survival of HNSCC in vivo model.
(A) Representative image and weight (g) of FaDu-xenografted tumors (n = 8–9) exposed to vehicle, adavosertib (ADV; 30 mg/kg or 90 mg/kg, daily, p.o.), alisertib (ALI; 30 mg/kg, daily, p.o.), or the combinations of alisertib with either adavosertib (30 mg/kg) or adavosertib (90 mg/kg). Scale bar: 1 cm. (B) Tumor volume was monitored twice a week. Humane endpoint was considered when tumor volume reached 1,000 mm3 following IACUC policy. (C) Overall survival of FaDu-xenografted mice treated with the drugs as single or combination (n = 8–9). (D) Representative image and weight (g) of Detroit 562-xenografted tumors (n = 6) exposed to vehicle, adavosertib (ADV; 30 mg/kg, daily, p.o.), alisertib (ALI; 30 mg/kg, daily, p.o.), or the combinations of alisertib with adavosertib (30 mg/kg). Scale bar: 1 cm. Graphs depict Mean ± SEM. Significant differences between the combinations and drug alone are exhibited. Statistical significance was assessed by Student’s t-test (**: P < 0.005). (E) Tumor volume was monitored every other day. Graphs depict Mean ± SEM. Significant differences between the combinations and drug alone are shown. Statistical significance was assessed by Student’s t-test (*: P < 0.05; **: P < 0.005) (F) Overall survival of Detroit 562-xenografted mice treated with the drugs as single or combination (n = 6). Log-rank (Mantel-Cox) testing was calculated by Prism 7. Significant differences between the combinations and drug alone are exhibited. (H) Representative IHC staining images of Ki-67 and cleaved-caspase 3 in FaDu-xenografted mice treated with the indicated drugs. Scale bar: 100 µm. (G) Representative immunofluorescent staining images of pCDK1 (Y15; Red), cytokeratin (Green) and DAPI (blue) in the FaDu-xenografted mice treated with the indicated drugs. Images in small box were enlarged with high power. Scale bars: 100 µm (large images) and 50 µm (small images).

