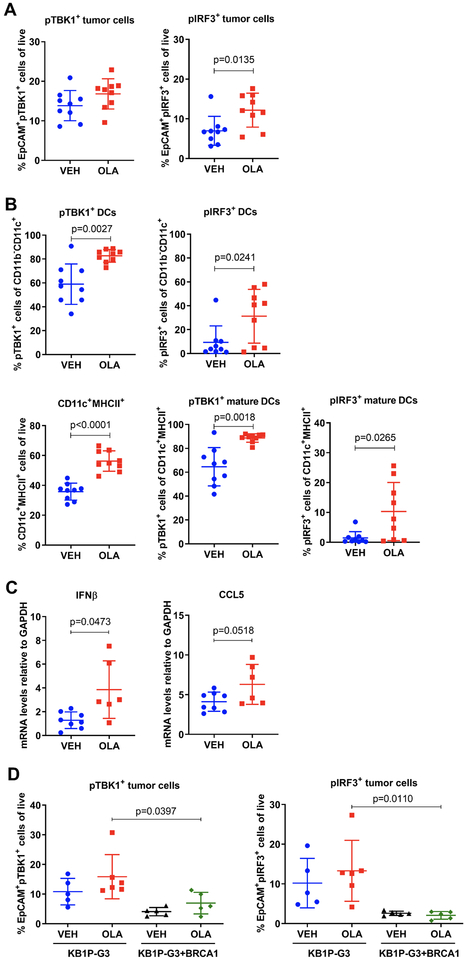
Figure 3. Olaparib induces pTBK1/pIRF3 signaling in tumor and dendritic cells from the K14-Cre-Brca1f/fTp53f/f GEMM of TNBC.
(A-B) Tumors from 9 vehicle- or olaparib-treated mice were harvested 5 days post-treatment and subjected to flow cytometry for analysis of pTBK1 and pIRF3 expression. Scatter plots demonstrate increases in (A) pTBK1+ and pIRF3+ epithelial (EpCAM+) cells, (B) DCs (CD11b−CD11c+) and mature (CD11c+MHCII+) DCs in olaparib-treated animals. Error bars represent SD. Statistical analyses were performed using unpaired t-tests or unpaired t-tests with Welch’s correction. (C) Tumors from 9 vehicle- or olaparib-treated mice were harvested at 5 days and analyzed for mRNA expression of IFNβ and CCL5 by qPCR. Error bars represent SD. Statistical analyses were performed using an unpaired t-test with Welch’s correction (left panel) or an unpaired t-test (right panel). (D) KB1P-G3 and KB1P-G3+BRCA1 tumors from 5–6 vehicle or olaparib-treated mice were harvested at 5 days post-treatment and subjected to flow cytometry. Scatter plots demonstrate % pTBK1+ and pIRF3+ epithelial (EpCAM+) cells. Error bars represent SD. Statistical analyses were performed using two-way ANOVA with Tukey’s post-hoc test.

