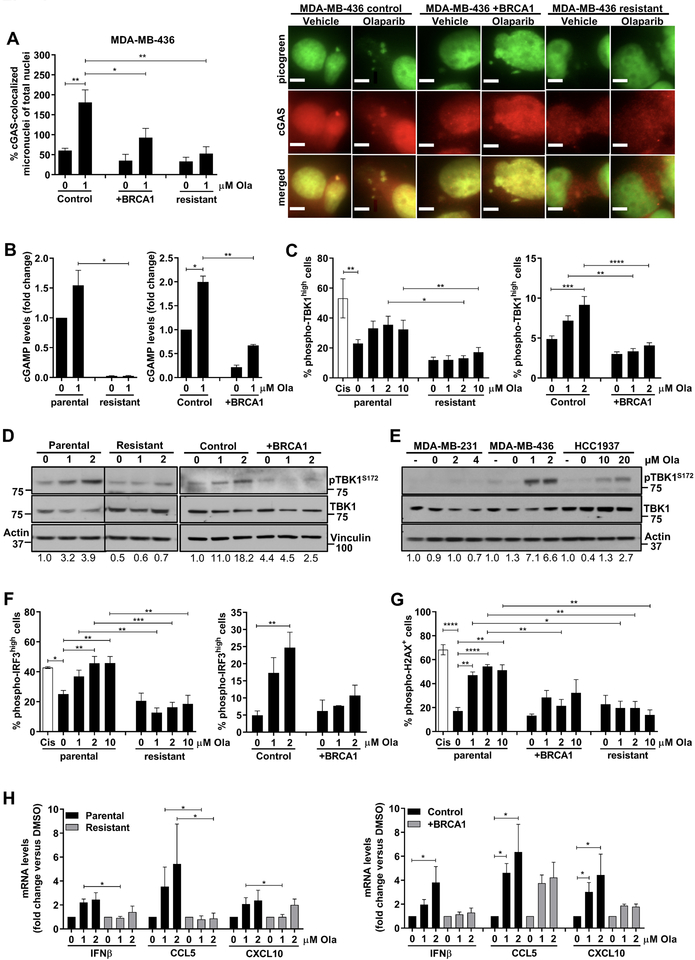
Figure 4. Olaparib activates the STING pathway more potently in HR-deficient TNBC cells compared to HR-proficient cells.
(A) The human TNBC isogenic cell line pair MDA-MB-436 control and BRCA1-reconstituted (+BRCA1) and a PARP inhibitor-resistant MDA-MB-436 clone were treated with DMSO (0 μM olaparib) or the indicated doses of olaparib for 72h and subjected to immunofluorescence with picogreen dye and anti-cGAS antibody. (Left panel) Quantification of micronuclei. Error bars represent SEM of 3 independent experiments. Statistical analysis was performed using one-way ANOVA with Sidak’s post-hoc test. (Right panel) Representative images of picogreen (green) and cGAS (red) stained micronuclei are shown (60x magnification). Scale bar, 8 μm; (B) At 72h post-treatment with DMSO or olaparib, lysates from parental and PARP inhibitor-resistant MDA-MB-436 cells, as well as MDA-MB-436 control and BRCA1-reconstituted cells (+BRCA1) were subjected to ELISA for cGAMP production. cGAMP levels were expressed as fold-change versus DMSO. Error bars represent SEM of 2 independent experiments. Statistical analysis was performed using Kruskal-Wallis test with Dunn’s post-hoc test; (C) The same cell lines were treated as in (B) and subjected to flow cytometric analysis of pTBK1Ser172 expression. Cisplatin (Cis; 1 μM) was used as positive control. Error bars represent SEM of 2–4 independent experiments. Statistical analysis was performed using one-way ANOVA with Sidak’s post-hoc test (left panel) or two-way ANOVA with Tukey’s post-hoc (right panel); (D) Cell lines were treated with DMSO or the indicated concentrations of olaparib for 72h and lysates were subjected to immunoblotting for pTBK1Ser172 and total TBK1 expression. Vertical black lines indicate points of blot cropping. (E) MDA-MB-436, HCC1937 and MDA-MB-231 human TNBC cell lines were treated with olaparib according to their 7-day IC50 values and subjected to immunoblotting for pTBK1Ser172 and total TBK1 expression. (F-G) Parental, PARP inhibitor-resistant, control and BRCA1-reconstituted MDA-MB-436 cells were subjected to flow cytometric analysis for pIRF3Ser396 and pH2AXSer139 expression. Cisplatin (Cis; 1 μM) was used as a positive control. Error bars represent SEM of 2–4 independent experiments. Statistical analysis was performed using one-way ANOVA with Sidak’s post-hoc test or two-way ANOVA with Tukey’s post-hoc. (H) qPCR analysis of IFNβ, CCL5 and CXCL10 mRNA levels in parental, PARP inhibitor-resistant, control and BRCA1-reconstituted MDA-MB-436 cells, normalized to GAPDH internal control. Error bars represent SEM of 4 independent experiments. Statistical analyses were performed using Kruskal-Wallis test Dunn’s post-hoc test.

