
Figure 1. Stability of osimertinib in reversible complexes with EGFR mutants.
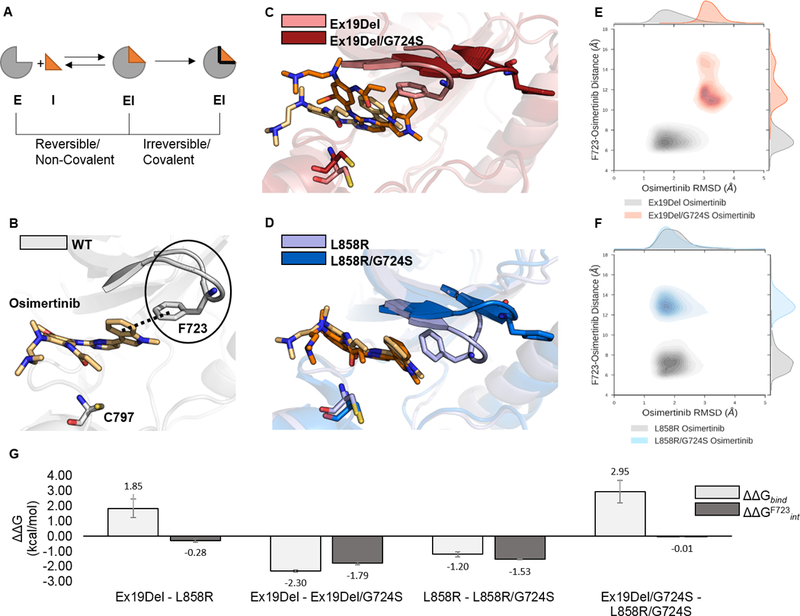
EGFR mutants reversibly bound to osimertinib were simulated with GaMD. A schematic representation of a simplified binding equilibrium for a covalently-binding inhibitor is depicted such that E = Enzyme target, I = Inhibitor, and EI = Enzyme-Inhibitor complex (A). Each simulation was performed in triplicate for a total of 12 independent 250 ns GaMD simulations. Representative images of osimertinib reversibly bound to WT (PDB ID 4ZAU; the solid black line indicates the bent P-loop; the dashed black line indicates the contact between the F723 phenyl and osimertinib indole ring; (B), Ex19Del and Ex19Del/G724S (C), and L858R and L858R/G724S (D) are displayed. Trajectory frames were extracted every 10 ps and plotted as osimertinib RMSD from the equilibrated start structure (x-axis) and distance between the phenyl ring of F723 and the indole ring of osimertinib (y-axis; E – F). RMSD vs. distance plots include data from 3 independent trajectories for each mutant – inhibitor pair (E – F). Select relative osimertinib binding free energies are plotted as averages across 3 independent trajectories; error bars indicate standard error of the mean (G).
ΔGbind = ΔEMM + ΔGsolv – TΔS
ΔGF723int = ΔEMM + ΔGsolv
ΔΔG = ΔG1 – ΔG2