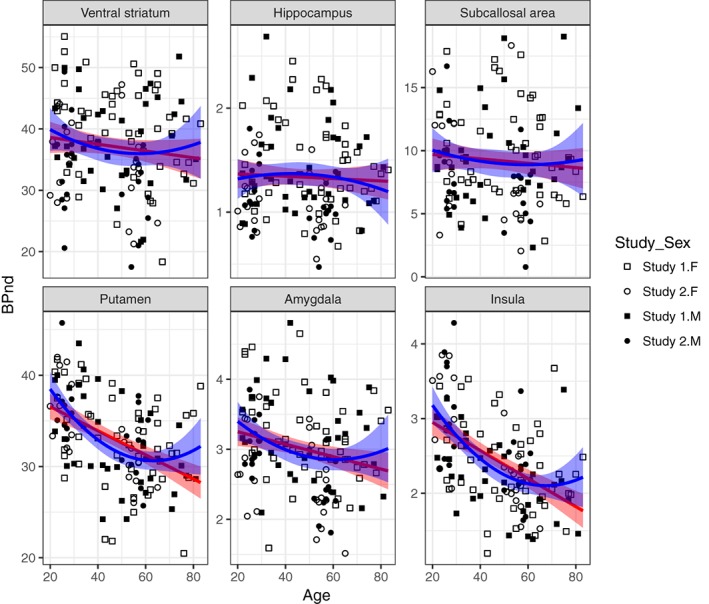
Figure 1.

Linear and quadratic effects of age on D2‐BPND in select regions of interest. Pictures, scatterplots, and statistics for each ROI are available in an interactive app online at http://13.58.222.229:3838/agebp/ [Color figure can be viewed at http://wileyonlinelibrary.com]
