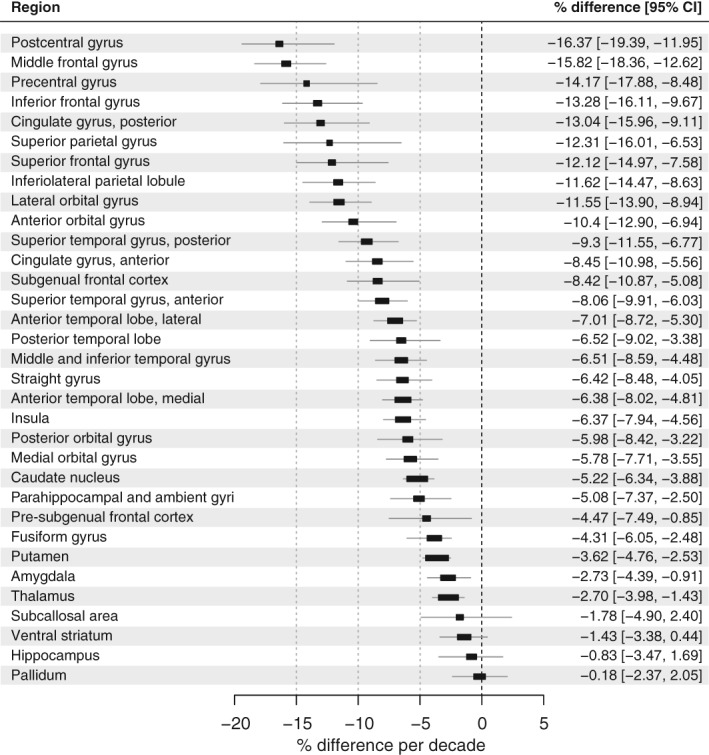
Figure 2.

Percentage difference in D2‐BPND per decade in regions of interest. Forest plot for all regions of interest. The position of the squares on the x‐axis indicates the estimated percentage change in D2‐BPND per decade and the horizontal bars indicate the 95% confidence intervals of the estimate. Nonoverlapping confidence intervals indicate significant differences at p < .01 (Cumming, 2014)
