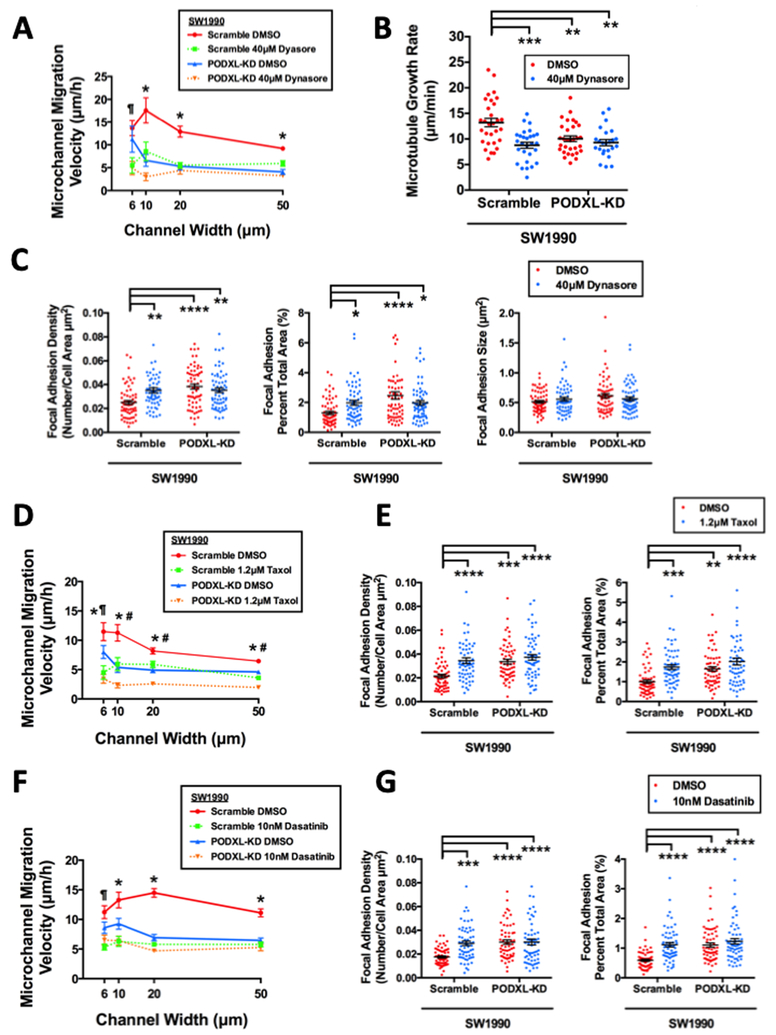
Fig. 4. Inhibiting dynamin-2, microtubules or Src kinase abrogates the migratory potentiation and cytoskeletal remodeling effects of PODXL.
(A) Migration velocity of scramble control and PODXL-KD SW1990 cells inside microchannels of prescribed width after treatment with dynasore (40 μM). Data represent the mean±S.E.M. from 3 independent experiments. * represents p<0.05 between scramble DMSO control and all three other conditions, ¶ represents p<0.05 between scramble DMSO control versus scramble plus dynasore or PODXL-KD plus dynasore. (B) Microtubule growth rate of scramble control and PODXL-KD SW1990 cells following dynasore (40 μM) treatment as measured by an EB1-GFP assay. Data represent the mean±S.E.M from 3 independent experiments. ** represents p<0.01, *** represents p<0.001. (C) FA density quantified as the number of discrete FAs per cell area (left panel) or FA area per total cell area (middle panel) and FA size (right panel) of scramble control and PODXL-KD SW1990 cells following dynasore (40μM) treatment, as assessed by TIRF imaging of phospho-paxillin immunostaining. Data represent the mean±S.E.M, * represents p< 0.05, ** represents p<0.01, *** represents p<0.001, **** represents p<0.0001. (D) Migration velocity of scramble control and PODXL-KD SW1990 cells inside microchannels of prescribed width after taxol (1.2 μM) treatment. Data represent the mean±S.E.M. from 3 independent experiments. * represents p<0.05 between scramble DMSO control and all three other conditions. # represents p<0.05 between PODXL-KD plus taxol versus scramble plus taxol or PODXL-KD plus DMSO control. ¶ represents p<0.05 between PODXL-KD plus taxol versus PODXL-KD plus DMSO control. (E) FA density quantified as described in (C) using scramble control and PODXL-KD SW1990 cells after taxol (1.2μM) treatment, as assessed by TIRF imaging of phospho-paxillin immunostaining. Data represent the mean±S.E.M. from 3 independent experiments. ** represents p<0.01, *** represents p<0.001, **** represents p<0.0001. (F) Migration velocity of scramble control and PODXL-KD SW1990 cells inside microchannels of prescribed width after dasatinib (10 nM) treatment. Data represent the mean±S.E.M. from 3 independent experiments. * represents p<0.05 between scramble DMSO control and all three other conditions, ¶ represent p<0.05 between scramble DMSO control versus scramble control plus dasatinib or PODXL-KD plus dasatinib. (G) FA density quantified as described in (C) using scramble control and PODXL-KD SW1990 cells after dasatinib (10 nM) treatment, as assessed by TIRF imaging of phospho-paxillin immunostaining. Data represent the mean±S.E.M from 3 independent experiments. *** represents p<0.001, **** represents p<0.0001.

