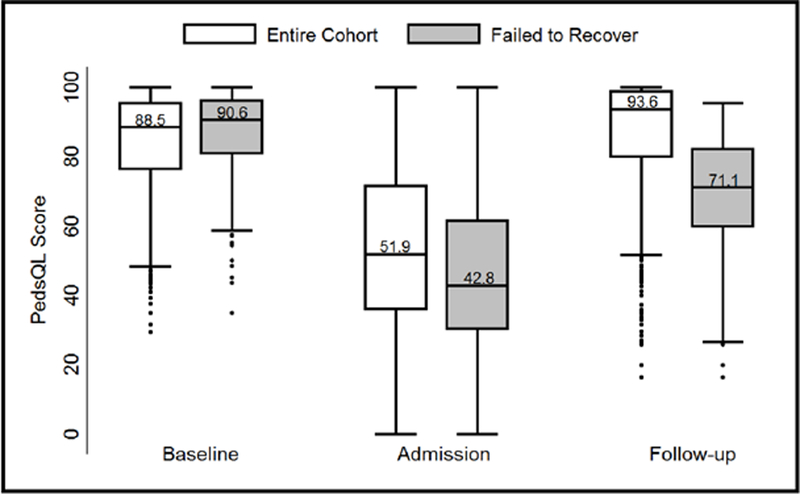
Figure 2:

Distribution of PedsQL™ scores at baseline, admission, and follow-up assessments for the entire cohort and for those who failed to recover to baseline health-related quality of life. Box-plots demonstrate median and interquartile range, with whiskers representing upper and lower adjacent values (1.5x the interquartile range) and dots representing outliers.
