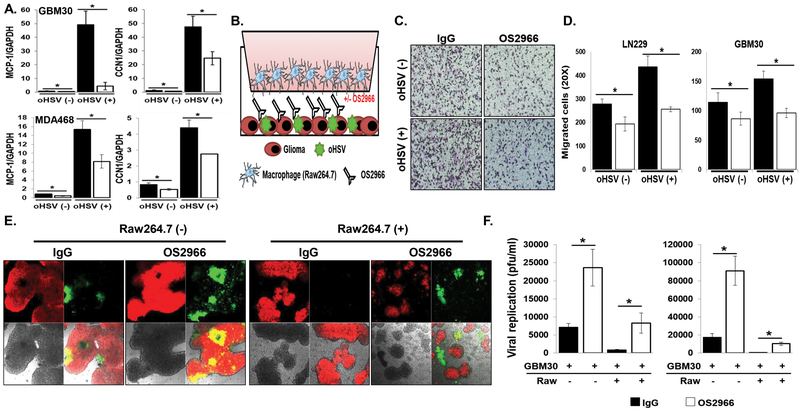
Figure 3. OS2966 inhibits migration of macrophages toward oHSV-infected tumor cells and enhances virus replication in co-culture with macrophages.
A) Real time PCR analysis for changes in gene expression of MCP-1 and CCN1 gene in both patient derived primary GBM (GBM30) and breast cancer cells 24 hours post oHSV treatment. Data presented are fold changes in gene expression ± SD relative to glyceraldehyde-3-phosphate dehydrogenase (GAPDH). B) Schematic of macrophage migration assay. C-D) LN229 or patient derived primary GBM (GBM12) cells treated with/without 34.5ENVE for 1 hour were treated with 10 ug/ml of IgG or OS2966 and serum starved macrophages were placed in the top chamber. Quantification of migrated Raw264.7 murine macrophages were measured by counting the number of cells that migrated to the bottom side of the transwell membrane 6 hours later. C) Representative image of transwell migration assay is shown for each group (×20), respectively. D) Quantification of the average number of migrated cells/view field (n = 4/group). Data points represent the mean, and error bars indicate ± SD for each group. E-F) Stably mCherry-expressing patient-derived primary GBM cells (GBM30) were treated with oHSV. Two hours post virus infection, unbound viruses were removed and cells were treated with 20 ug/ml of control IgG or OS2966 and then overlaid with serum starved murine macrophage Raw264.7 cells. E) Forty-eight hours post co-culture with macrophage, co-culture with oHSV and OS2966 treated cells showed increased GFP-positive, infected cells relative co-culture with oHSV and control IgG treated cells. F) Both cells and media were harvested 48 hours after co-culture and viral titers were determined by standard plaque assay. Data points represent the mean, and error bars indicate ± SD for each group. Asterisks indicate statically significant differences between indicated pairs.

