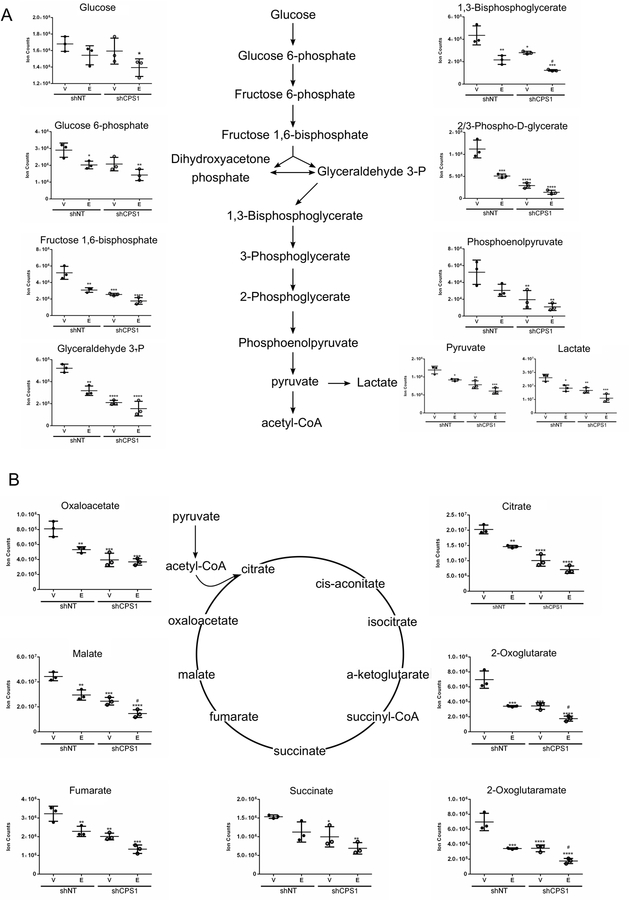
Figure 4. Metabolites involved in carbon metabolism are decreased by CPS1 knockdown with further exacerbation upon EGFR inhibition.
HCC4006 cells were treated with vehicle (DMSO) or 100 nM erlotinib for 22 hours in replicates of three. Cell extracts were processed for metabolic profiling using UPLC-MS/MS. A. Levels of glycolysis metabolites B. Levels of TCA cycle intermediates. ANOVA; *P ≤ 0.05, **P ≤ 0.01, ***P ≤ 0.001 for comparisons of all samples to vehicle-treated control shNT cells, and pound signs indicate statistical significance (#P ≤ 0.05, ##P ≤ 0.01, ###P ≤ 0.001) for comparisons of CPS1 knockdown cells to control shNT cells under the same treatment conditions.

