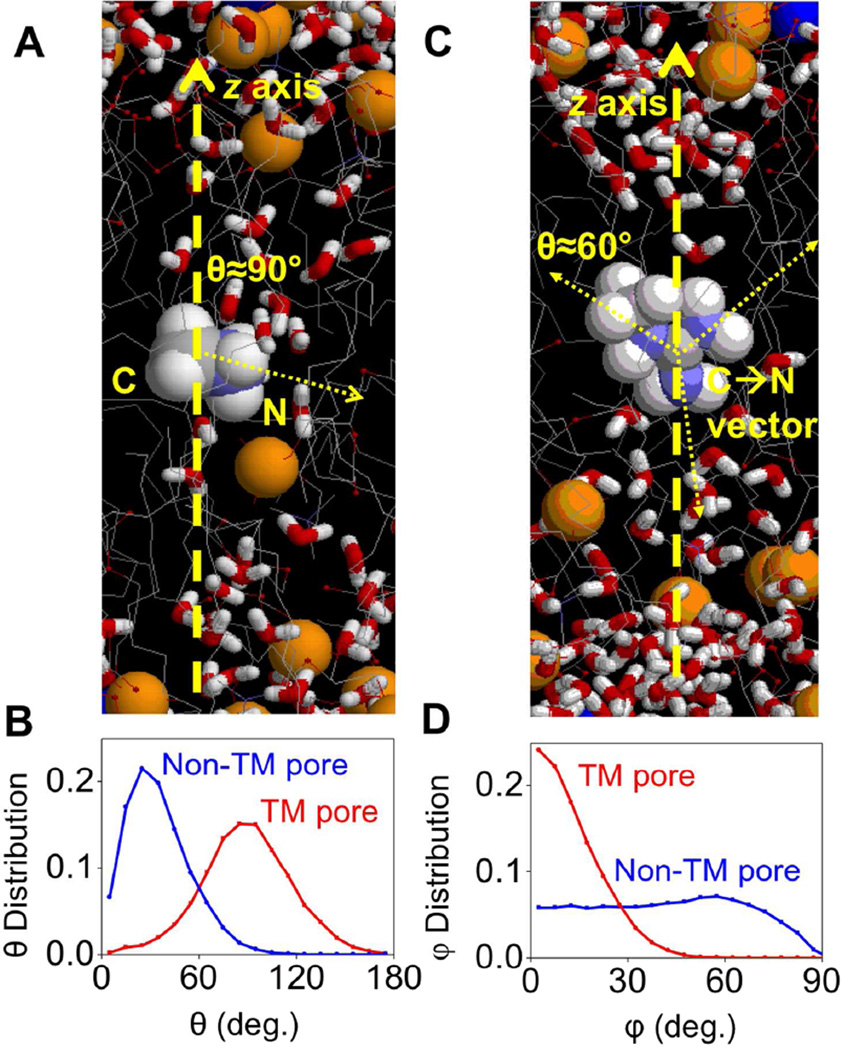
Figure 9.
(A) A snapshot taken from MamH+/DLPC simulations when a TM Pore occurs in the very beginning. Yellow spheres represent phosphorus atoms; gray lines represent hydrocarbon tails of lipids; Water molecules are shown as red and white sticks. Refer to Fig. 8A for Mam+/DLPC simulation snapshot without a TM pore. (B) The normalized distribution of angles between C-N vector and z-axis in MamH+/DLPC simulations (z=0), when TM pores occur (red) or do not (blue). (C) A snapshot of MguanH+/DLPC simulation with a TM pore, where the 2 upward C-N vectors of MguanH+ form angles around ±60° with the z-axis, and the downward one forms an angle of about 180°. (D) The normalized distribution of angles between the MguanH+ molecular plane (defined by the 3 N atoms) and the z-axis in MguanH+/DLPC simulations, when TM pores occur (red) or do not (blue).

