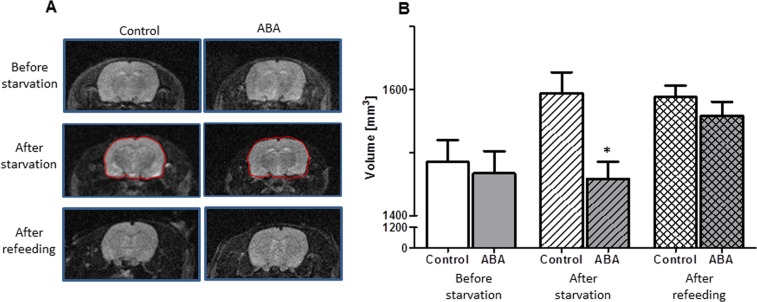
Fig. 2. Consequences of refeeding on the total brain volume as determined by MRI analysis.
The figure depicts exemplary MRI images (a) and the mean total brain volume and corresponding standard deviation of ABA and control animals at three different time points (b): before starvation, after starvation and after refeeding. Analysis of MRI brain volume in the ABA and control animals was performed using a linear mixed effects model with a random intercept and unstructured covariance. Pairwise comparisons were evaluated using the corresponding linear contrasts. *p ≤ 0.05

