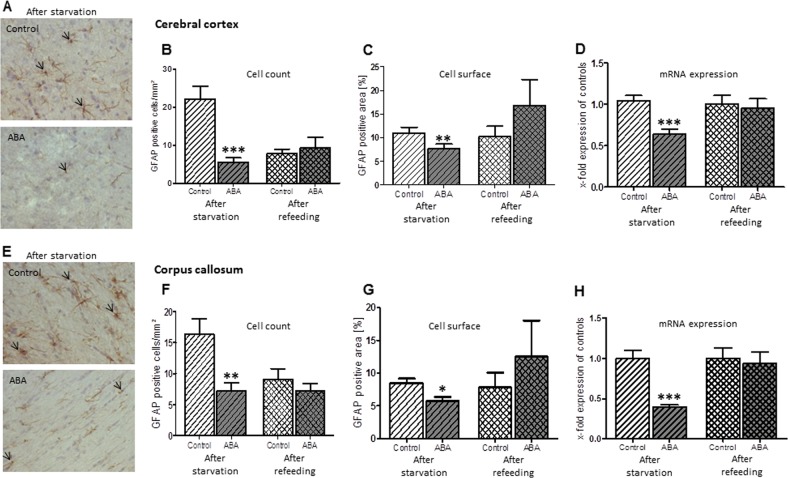
Fig. 4.
The figure shows the mean number of astrocytes, mean GFAP-positive cell surface area and mean mRNA expression of GFAP with respective SDs after starvation and refeeding in the cerebral cortex (a) and corpus callosum (e). In the cerebral cortex and corpus callosum, the number of astrocytes was significantly reduced compared to controls following starvation, and this reduction was recovered after refeeding (b, f, respectively). Similarly, the total cell surface areas in both regions were significantly reduced following starvation but not refeeding (c, f). Furthermore, the ABA group showed a significant reduction in GFAP mRNA expression in both regions following starvation, while no alterations occurred after refeeding (d, h). *p ≤ 0.05; **p ≤ 0.01; ***p ≤ 0.001, two-sided Student’s t-test

