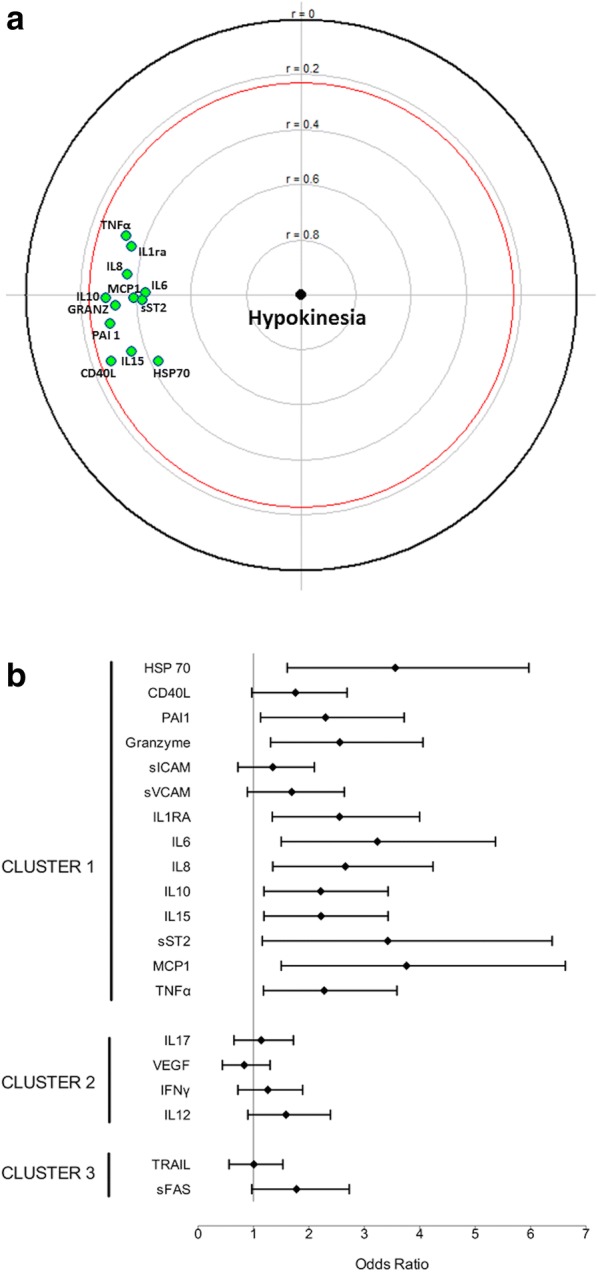
Fig. 2.

Forest plot for odds ratios (a) and focused principal component analysis (FPCA, b) for the association between sepsis mediators and septic myocardial dysfunction. FPCA is a simple graphical display of correlation structures focusing on a particular dependent variable. The display reflects primarily the correlations between the dependent variable and all other variables (covariates) and secondarily the correlations among the covariates. The dependent variable (septic myocardial dysfunction, SMD) is at the center of the diagram, and the distance of this point to a covariate faithfully represents their pairwise Spearman correlation coefficient (using ranked values of continuous variables). Green covariates are positively correlated with the dependent variable. For parsimony, only covariates significantly correlated with the dependent variable (with a p value < 0.05 and inside the red circle) are displayed. The diagram also shows relationships between covariates as follows: Correlated covariates are close (for positive correlations, allowing identification of clusters) or diametrically opposite vis-à-vis the origin (for negative correlations), whereas independent covariates make a right angle with the origin. See text for sepsis mediators’ abbreviations
