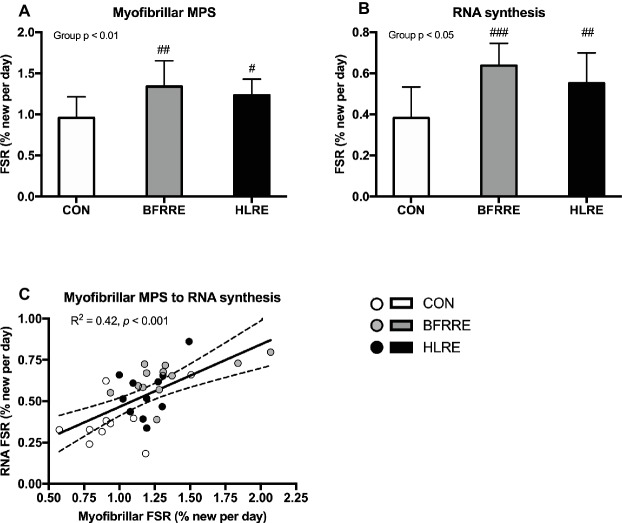
Figure 3.
Myofibrillar protein (A) and RNA (B) synthesis rates (%/day) during the intervention period. Correlation between myofibrillar FSR and RNA FSR (C). Data are presented as mean ± SD in (A,B). In (C), data are presented as individual values and a linear regression line (solid) with 95% CI (dashed). Overall group effect is given in the upper left corner of graphs of (A) and (B). R square and significance is given in the upper left corner of (C). #p < 0.05, ##p < 0.01, and ###p < 0.001 different from CON.

