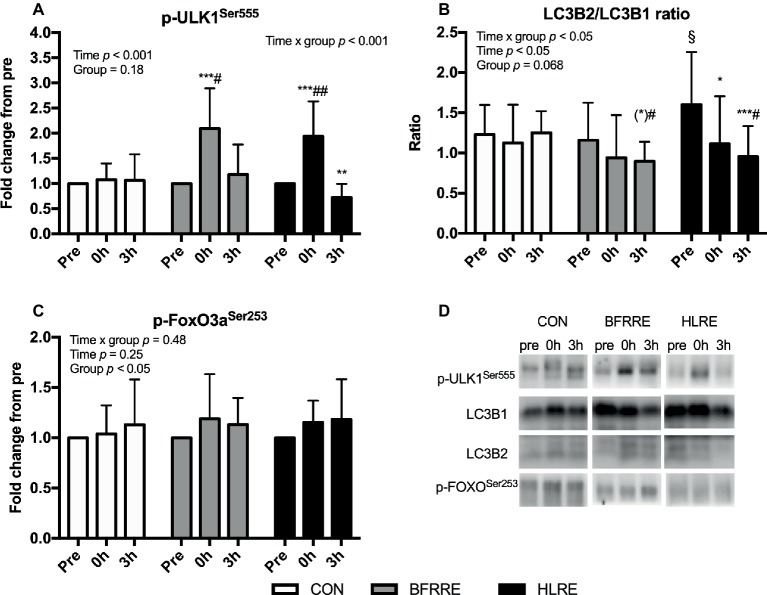
Figure 5.
Phosphorylation of ULK1 at Ser555 (A), the ratio of LC3B2 to LC3B1 (B) protein expression, and (C) phosphorylation of FoxO3a at Ser253 immediately (0 h) and 3 h (3 h) after acute exercise. Data are presented as mean ± SD. Overall effects are given in the upper left corner of graphs. *p < 0.05, **p < 0.01, and ***p < 0.001 different from pre within group; (*)p < 0.1 tendency toward difference from pre within group; §p < 0.05 different from BFRRE within time-point; #p < 0.05 and ##p < 0.01 different from CON within time-point. Representative blots are shown in (D).

