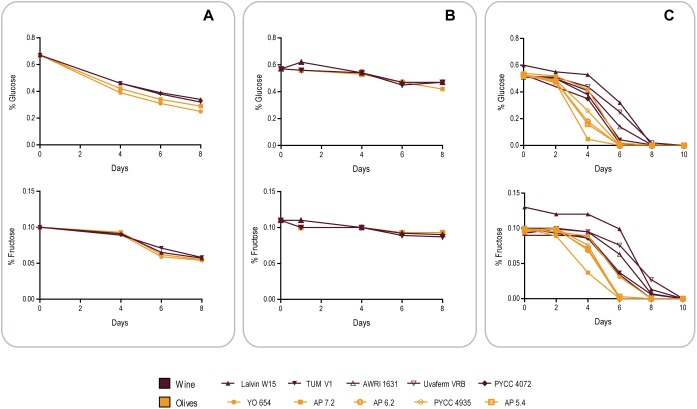
FIGURE 4.
Comparison of glucose (initial concentration 0.6% w/v) and fructose (initial concentration 0.1% w/v) consumption by representatives of the Olives and Wine population of S. cerevisiae in different conditions. (A) Olive brine. (B) Phosphate buffer supplemented with 8% w/v NaCl. (C) Phosphate buffer supplemented with 8% w/v NaCl and 0.1% w/v yeast extract.

