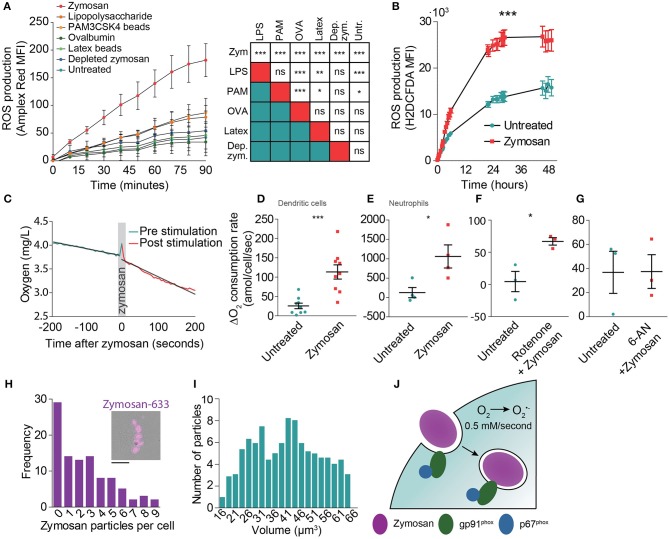
Figure 2.
Determination of the oxygen consumption rate (OCR) of monocyte-derived dendritic cells following zymosan exposure. (A) ROS production by monocyte-derived dendritic cells exposed to a range of phagocytic cargoes and soluble TLR stimuli as determined by Amplex Red fluorescence. MFI: mean fluorescence intensity. Shown is the average of three donors ± SEM. The table shows results from linear regression analysis on the integrated curves (***p < 0.001; **p < 0.005; *p < 0.01). (B) ROS production by zymosan-exposed monocyte-derived dendritic cells as determined by H2DCFDA fluorescence. Shown is the average of three donors ± SEM. p < 0.0001; linear regression analysis on the integrated curves. (C) Temporal decline in oxygen levels in the culture medium before and after stimulation with zymosan in a closed container of a representative donor. (D) Difference in OCR of monocyte-derived dendritic cells before and after stimulation with zymosan in a closed container. Each data point presents an individual donor (n = 9). p = 0.0005; paired Student's t-test. (E) Same as panel (D), but with neutrophils (n = 3). p = 0.0143; paired Student's t-test. (F) Difference in OCR in monocyte-derived dendritic cells before and after stimulation with zymosan with simultaneous addition of the mitochondrial complex I inhibitor Rotenone (n = 3). p = 0.0256; paired Student's t-test. (G) Difference in OCR before and after stimulation with zymosan in a closed container in cells pre-incubated for 1 h with the glucose-6-phosphate dehydrogenase inhibitor 6-aminonicotinamide (6-AN) (n = 3). p = 0.9868; paired Student's t-test. (H) Frequency distribution of the number of zymosan particles taken up by monocyte-derived dendritic cells following 30 min exposure to zymosan (99 cells pooled for three different donors; bin size: 1 particle). Insert: Representative epi-fluorescence microscopy image of a cell with phagocytosed Alexa Fluor 633-labeled zymosan (magenta). Scale bar: 10 μm (I) Frequency distribution of the volume of zymosan particles from microscopy (521 zymosan particles in total; bin size: 5 μm3). (J) Model figure of NOX2 activity during phagocytosis by monocyte-derived dendritic cells. NOX2 is already assembled and active before closure of the phagocytic cup and remains active on the phagosomal membrane for on average at least 10 h. NOX2-mediated conversion of oxygen (O2) to superoxide anion (O) results in a production rate of ROS of approximately 0.5 mM/s.

