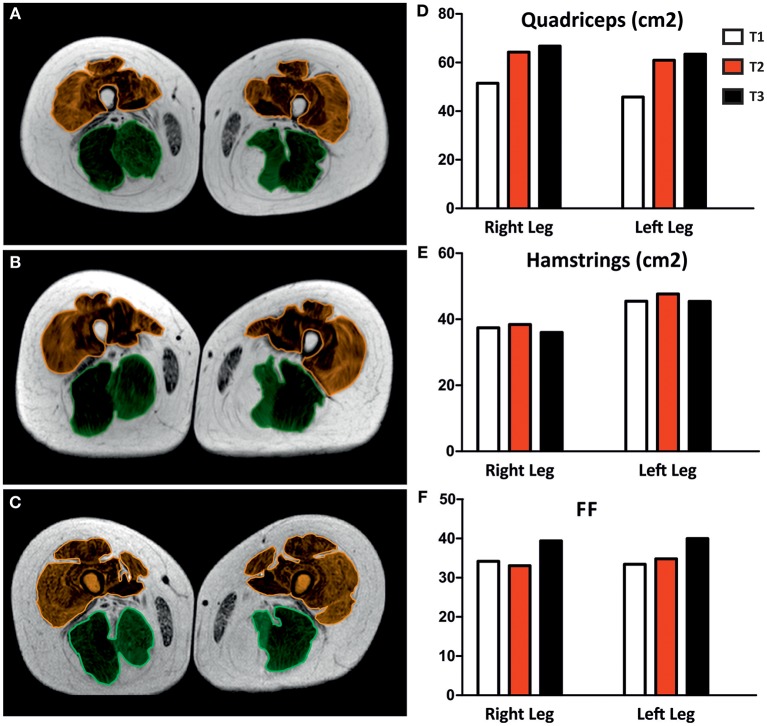
Figure 3.
Magnetic Resonance Images (MTI) of thigh muscles. MRI was performed after 5 (A; T1), 14 (B; T2), and 26 months (C; T3) of home-based FES. The cross-sectional area of quadriceps (brown) and hamstrings (green) muscles was estimated and plotted in (D,E), respectively. Histogram in (F) show the variation of fat fraction (FF) during FES treatment.

