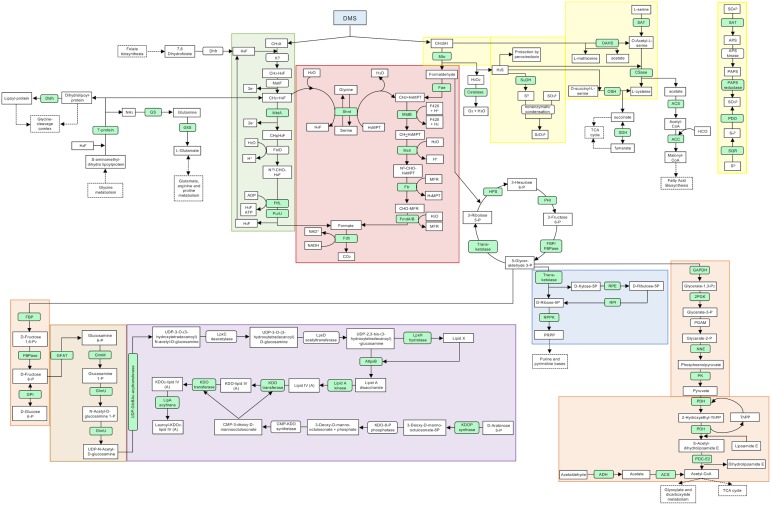
FIGURE 1.
Proposed pathways and reactions in Methylophaga thiooxydans DMS010 grown on DMS. Metabolic map showing selected pathways of M. thiooxydans DMS010. Metabolic pathways, both predicted from genome and proteomic analysis are presented in a simplified bacterial cell. Proteins detected in the proteomic analysis are indicated in light green and those not detected are indicated in white. Main metabolites are shown in square boxes and enzymes are shown in oval boxes. Some KEGG categories are indicated by color; green, one carbon pool by folate; blue, pentose phosphate path-ways (parts); orange, glycolysis; beige/brown, amino sugar and nucleotide sugar metabolism; purple, lipopolysaccharide biosynthesis; red, methane metabolism and yellow, sulfur metabolism. A solid arrow stands for an enzymatic reaction and a dashed arrow stands for multistep pathway. Abbreviations are explained in more detail in Supplementary Table S4; X? – uncharacterized DMS methyltransferase.

