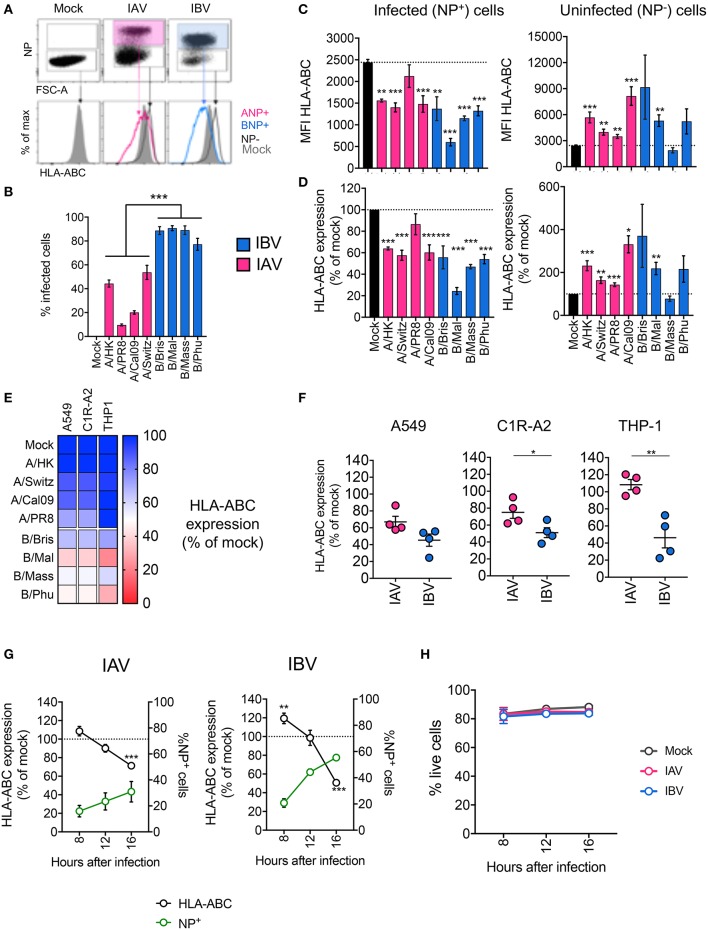
Figure 1.
Infection with IAV and IBV leads to downregulation of MHC-I. (A–C) Changes in surface MHC-I expression during in vitro IAV and IBV infection of A549 cells. Cells were infected with IAV/IBV or mock-treated and MHC-I (HLA-ABC) expression was analyzed on total live mock-treated samples and NP− or NP+ for IAV/IBV-treated samples. (A) Representative FACS plots of NP staining and MHC-I expression. (B) Infections rates for different IAV and IBV strains. (C) HLA-ABC expression on uninfected (NP−) and infected cells (NP+) as geometric Mean Fluorescence Intensities (MFI). (D) Relative HLA-ABC expression on uninfected (NP−) and infected cells (NP+) compared to mock-treated cells. Mean and SEM are shown for n = 6, pooled data from two independent experiments, each performed in triplicate. (E) Relative HLA-ABC expression on infected cells (NP+) compared to mock-treated cells, for a panel of IAV and IBV strains, across cell lines. Mean value shown (n = 6, pooled data from two independent experiments, each performed in triplicate). (F) Relative HLA-ABC expression on infected cells (NP+) compared to mock-treated cells, for IAV and IBV viruses, where each data point represents the mean value (as above) for one strain. (G) Timecourse of MHC-I downregulation my IAV and IBV. Relative HLA-ABC expression on infected cells (NP+) compared to mock-treated cells, for IAV and IBV. The frequency of NP+ cells is also shown. (H) Cell viability after influenza infection at different timepoints after infection. Mean and SEM are shown for n = 6, pooled data from two independent experiments, each performed in triplicate. Statistical significance was determined using unpaired Student's t-test throughout the figure with *p < 0.05, **p < 0.01, ***p < 0.001.

