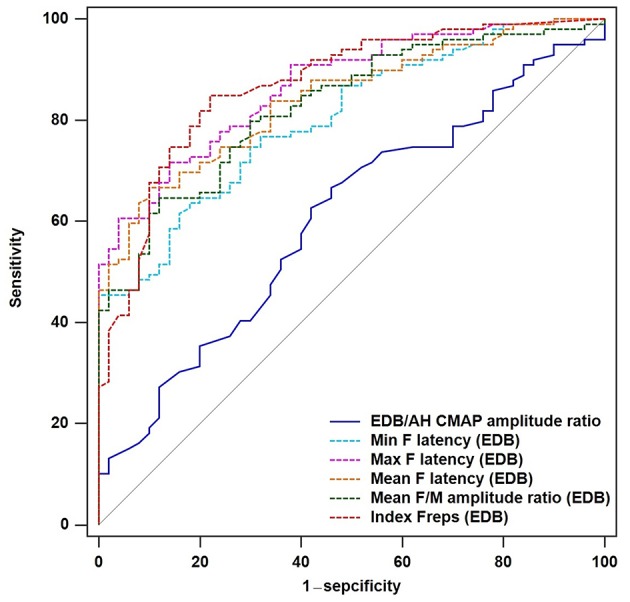
Figure 3.

ROC curves for the EDB/AH CMAP amplitude ratio and EDB F-wave variables. Receiver operator characteristic (ROC) curve analysis revealed that the minimal, maximal and mean F-wave latencies, mean F/M amplitude ratio, and index Freqs of the EDB appeared to strongly differentiate patients with ALS from the HCs compared with the EDB/AH CMAP amplitude ratio. These F-wave variables of the EDB had areas under the curve (AUCs) > 0.8.
