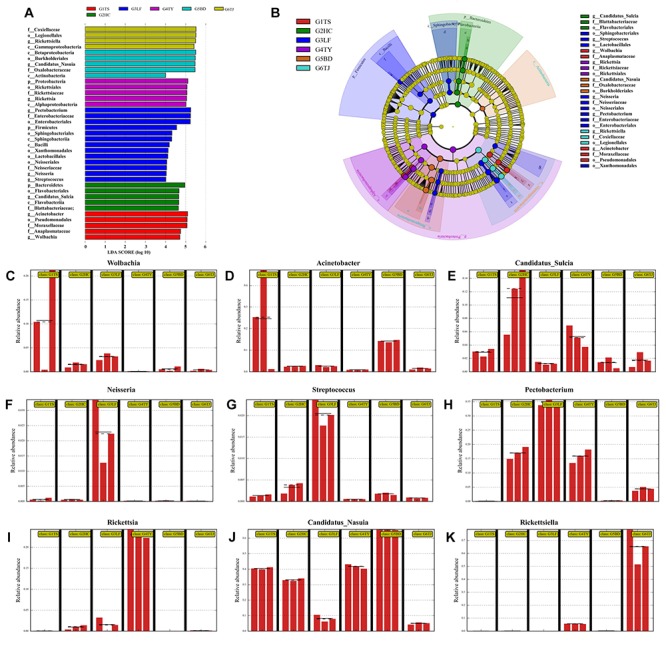
FIGURE 3.

Distinct biomarkers of the bacterial community from different leafhopper populations revealed by linear discriminant analysis (LDA). Multiple regression results are shown for LDA of microbiomes from different populations with LDA > 4. Colors indicate the different populations of the phylogenetic component contributing to group uniqueness (A). Cladogram of the LDA results in panel A. Levels of the cladogram represent, from the inner to outer rings, phylum, class, order, family, and genus. Color codes indicate the six populations, and lower-case letters indicate the taxa that contribute to the uniqueness of the corresponding leafhopper populations (B). (C–K) Relative abundance of distinct bacteria in the different populations: Wolbachia (C), Acinetobacter (D), Candidatus_Sulcia (E), Neisseria (F), Streptococcus (G), Pectobacterium (H), Rickettsia (I), Candidatus_Nasuia (J), Rickettsiella (K). G1TS: Tianshui; G2HC: Hancheng; G3LF: Linfen; G4TY: Tianjin; G5BD: Baoding; G6TJ: Tianjin.
