Figure 3.
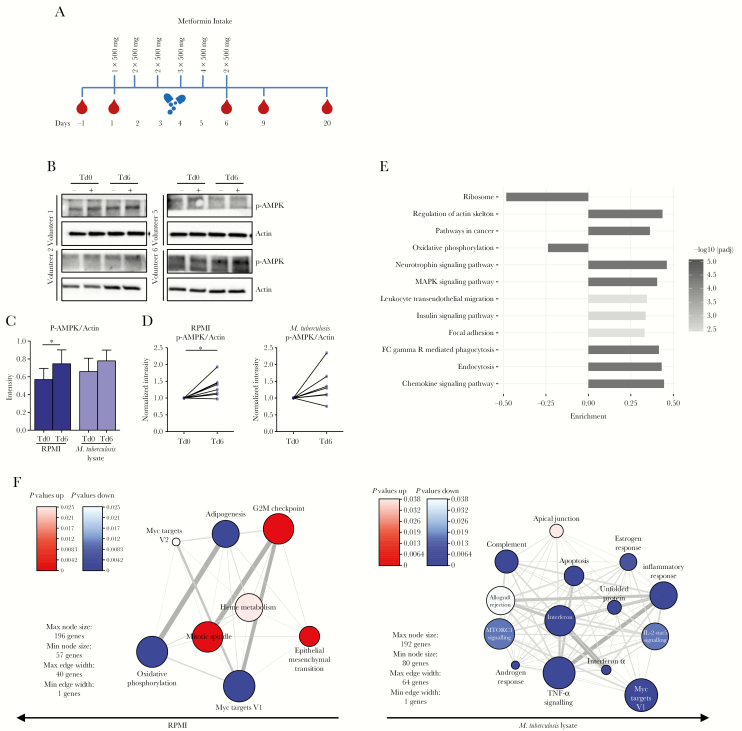
Global effects of metformin in healthy human volunteers. A, Healthy volunteers (n = 11) received an increasing dose of metformin for 5 consecutive days. Blood specimens were collected twice before and several times after metformin treatment. B, Western blot analysis of p-AMPK in lysates of peripheral blood mononuclear cells (PBMCs) collected from healthy volunteers before and after metformin intake and stimulated for 2 hours with Roswell Park Memorial Institute medium (RPMI; −) or Mycobacterium tuberculosis lysate (+). Four representative donors are shown. C, Quantitative relative band intensity analysis of phospho-AMPK (p-AMPK) before (treatment day 0 [Td0]) and after (Td6) metformin treatment in samples stimulated with RPMI or M. tuberculosis lysate. Data are means ± standard errors of the mean for 8 donors. D, Fold change in p-AMPK levels before (Td0) and after (Td6) metformin treatment in samples stimulated with RPMI or M. tuberculosis lysate. Data for 8 donors are shown. *P < .05 and **P < .01, by the paired t test. Western blot data are normalized to the loading control, actin. E, Gene set analysis of RNA sequencing data, showing Kyoto Encyclopedia of Genes and Genomes pathways that were differentially expressed in ex vivo blood samples following metformin administration. The bar length indicates the magnitude of the change of expression of the gene set. Data were analyzed using the Piano R package, and pathways with adjusted P values < .01 are shown. F, Hallmark gene set enrichment and network analysis, showing gene sets upregulated (red) or downregulated (blue) following metformin administration in resting PBMCs or those stimulated with M. tuberculosis lysate for 4 hours. The color intensity indicates the adjusted P value for the gene set enrichment. IL-2, interleukin 2; TNF-α, tumor necrosis factor α.

