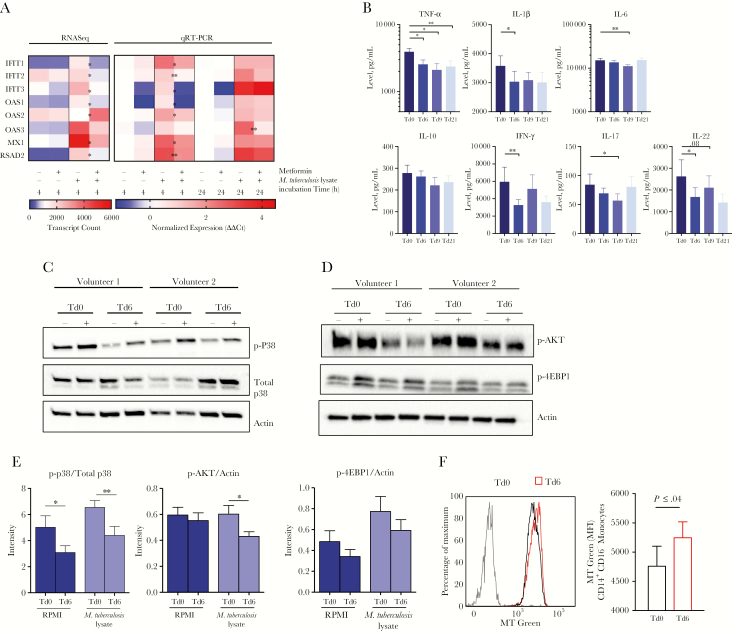
Figure 4.
Metformin intake in healthy volunteers affects cytokine production via p38 and AKT inhibition. A, Expression of 8 genes in the “response to type 1 interferon” Gene Ontology group among peripheral blood mononuclear cells (PBMCs) collected before and after in vivo metformin administration from healthy volunteers and stimulated with Mycobacterium tuberculosis lysate in vitro for 4 or 24 hours. Expression measured by RNA sequence (RNAseq) analysis (at 4 hours) and quantitative reverse transcription–polymerase chain reaction (qRT-PCR) analysis (at 4 and 24 hours). B, Cytokine production from isolated PBMCs collected before and after metformin intake and stimulated with M. tuberculosis lysate for 24 hours (for tumor necrosis factor α [TNF-α], interleukin 6 [IL-6], interleukin 1β [IL-1β], and interleukin 10 [IL-10]) or after 7 days (for interferon γ [IFN-γ], interleukin 17 [IL-17], or interleukin 22 [IL-22]) in the presence of 10% pooled human serum. C and D, Findings of Western blot analysis of phospho-p38 (p-p38) and total p38 levels (C) and p-AKT and p-4EBP1 levels (D) in lysates of PBMCs collected from healthy volunteers before and after metformin intake and stimulated for 2 hours in Roswell Park Memorial Institute medium (RPMI; −) or M. tuberculosis lysate (+). Data are representative of 4 of 8 evaluated donors from the trial. Western blot data are normalized to the loading control, actin. E, Fold change in p-p38/total p38 levels, p-AKT/actin levels, or p-4EBP1/actin levels in PBMCs collected before (treatment day 0 [Td0]) versus those collected after (Td6) metformin treatment and stimulated with RPMI or M. tuberculosis lysate. F, Mitochondrial mass assessment in CD14+CD16- monocytes. The left panel is overlay of data from before and after metformin treatment in a specimen from the same individual. The right panel should the median fluorescence intensity (MFI) yielded by MitoTracker Green (MT) in 3 samples. Gray, FMO control. *P < .05 and **P < .01, by the paired t test. Western blot data are mean values ± standard errors of the mean and are representative of 8 donors presented in panels C or D or Supplementary Figure 3A or 3B.

