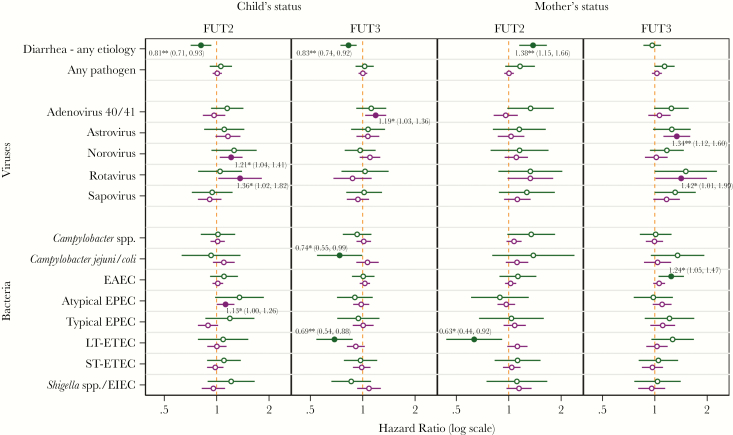
Figure 4.
Hazard ratios for diarrhea and for infection with common enteric pathogens comparing phenotype positive to negative status from multivariate Cox models that adjusted for mothers’ fucosyltransferase (FUT)2 and FUT3 status (for child estimates) and child’s FUT2 and FUT3 (for maternal estimates) and covariates stratified by diarrheal (green) and surveillance (purple) stool samples. Statistically significant estimates (P ≤ .05) are represented by solid markers and labeled with the hazard ratio (with 95% confidence interval; ***, P < .001, **, P = .001–.01, and *, P = .01–.05) and significance level.

