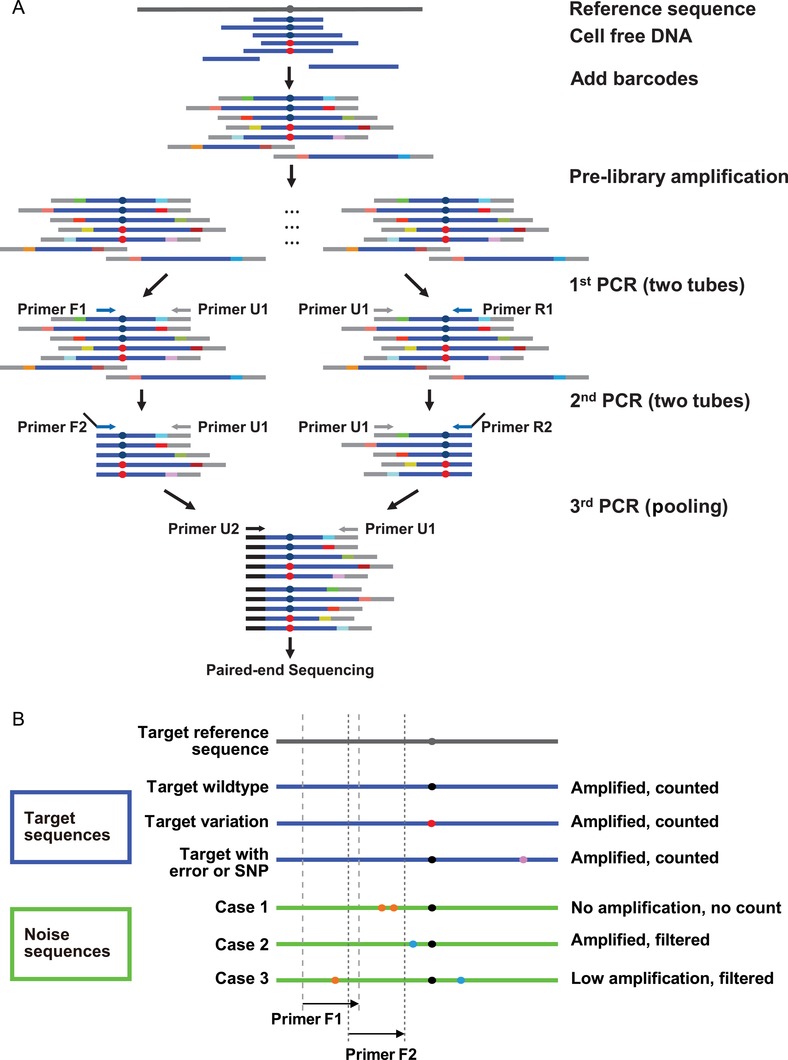
Figure 1.

Schematic representation of the cfBEST method. Dark blue and red dots denote wild‐type and mutant sites of interest, respectively. A) The cfBEST protocol. Blue bars denote cfDNA fragments and different colored bars adjacent to the blue bars denote the degenerated barcodes. A prelibrary was built (see the Experimental Section) by amplifying barcoded cfDNA fragments to generate sufficient templates, which was split into two equal portions (referred as “F” and “R”). Each portion was used for the following two PCR reactions: The first PCR with a universal primer (U1) and a target‐specific primer (F1/R1) that was close to the site of interest; the second PCR with the same universal primer (U1) and another primer (F2/R2) containing both a target‐specific part that bound to the region closer to the site of interest than F1/R1 and a universal tail part that was the same as U2. The two portions were pooled together and the third PCR with U1 and U2 was performed for the subsequent massively parallel paired‐end sequencing. In the first and second PCR reactions, two target‐specific primers in the same portion formed a “semi‐nested” PCR to increase the specificity. The design that both primers were bound to near the site of interest could minimize the bias caused by size differences. Each of the barcoded single‐allelic molecules was amplified and sequenced multiple times (reads) and the multiple reads containing the same barcode and breakpoint together were grouped to call a unique original allelic molecule. Therefore, the PCR efficiency did not cause bias, either. B) The strategy for eliminating sequences from pseudogenes or homologous genes (“noise” sequences). The regions flanking the site of interest were analyzed for primer design. A qualified primer was identical to the reference sequence, which was able to amplify the target region (blue lines) without producing noise sequences from other regions (green lines). In most cases, the variations in the primer binding region (orange dots) led to no amplification (case 1); in other cases, there was only one or no variations in the primer binding region, which resulted in an amplified product of noise sequence (case 2) or low‐efficiency amplification (case 3). In order to count reads accurately, a filtering process was designed to eliminate noise sequences. For noise case 1, the PCR did not amplify any noise product. For cases 2 and 3, the unique variation patterns (blue dots) between them and the reference sequence were exploited to filter noise sequences in the bioinformatic analysis step. The sequencing/amplifying error caused by accidental mismatches or SNP (purple dot) in sites different from the variation patterns were allowed. F1/F2 primers are shown as an example in the illustration for one side. For the other side, R1/R2 primers were the same as F1/F2.
