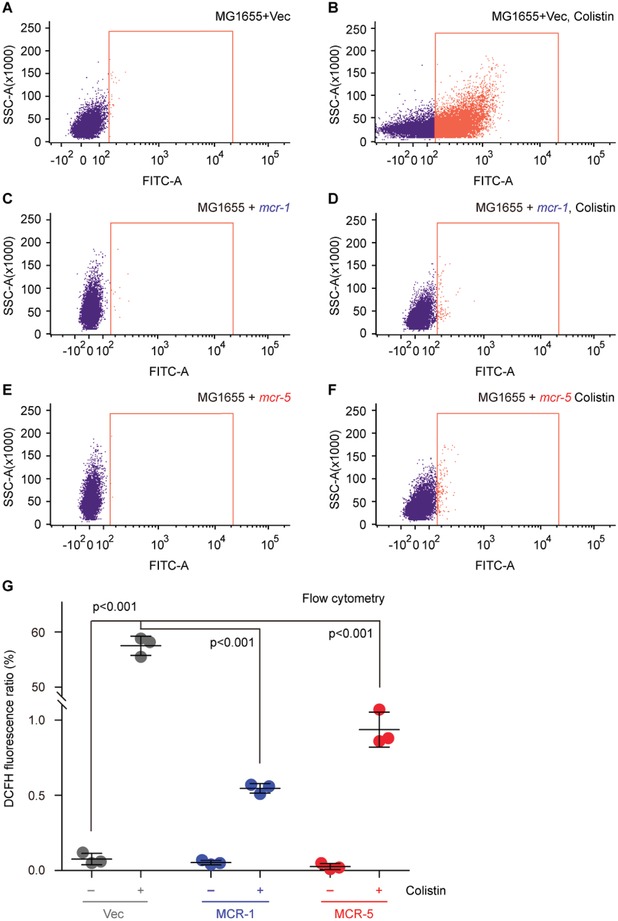
Figure 9.

FACS analyses of colistin‐induced ROS level in E. coli. A,B) The colistin treatment boosts the accumulation of ROS in E. coli with empty vector. C,D) The presence of colistin cannot promote efficient formation of ROS in mcr‐1‐harboring in E. coli. E,F) The expression of MCR‐5 catalyzes the attachment of PEA to the suggestive 4′‐phosphate position of lipid A anchored on E. coli surface and prevents efficient production of intracellular ROS. G) Use of flow cytometry to measure the relative level of ROS in E. coli alone or carrying mcr‐1/5. Flow cytometry of ROS was performed with a BD FACSVerse flow cytometer in which around 10 000 cells are counted at a flow rate of 35 mL min−1. The fluorescence of the dye DCFH2‐DA was excited with a 488 nm argon laser and emission was detected with the FL1 emission filter at 525 nm using FL1 photomultiplier tub. The minus symbol denotes the absence of colistin, and the plus symbol refers to the addition of colistin. The data were expressed using one‐way analysis of variance (ANOVA) followed by Tukey–Kramer multiple comparisons post hoc test.47 Statistical significance was set at p < 0.001. Designations: Vec, pBAD24; “−,” no addition of colistin; “+,” addition of colistin.
