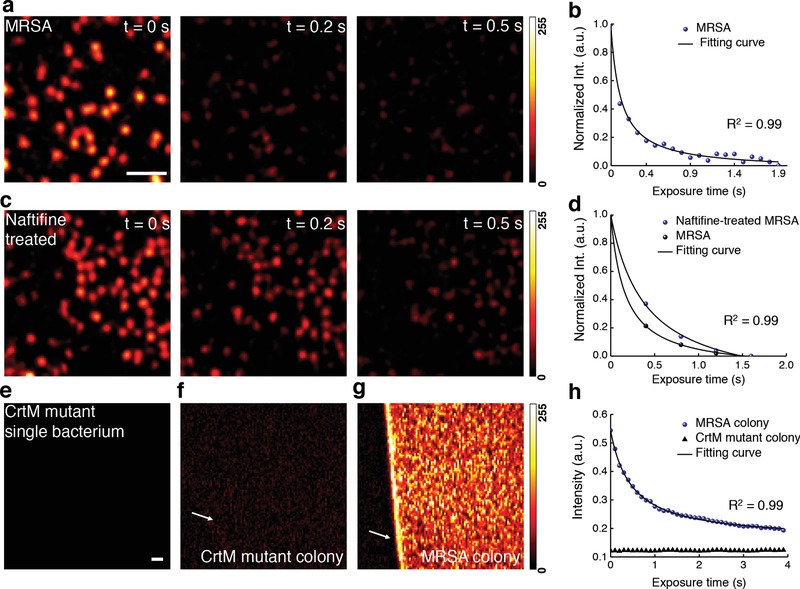
Figure 1.

Photobleaching of staphyloxanthin in MRSA uncovered by transient absorption microscopy. a) Pseudocolor time‐lapse images of MRSA. Scale bar = 5 µm, applies to images in (a) and (c). b) Representative time‐lapse signal (normalized) from MRSA. c) Pseudocolor time‐lapse images of naftifine‐treated MRSA. d) Representative time‐lapse signals (normalized) from MRSA and naftifine‐treated MRSA. e–g) Pseudocolor images of CrtM mutant, CrtM mutant colony, and MRSA colony at t = 0 s, respectively. Scale bar = 20 μm, applies to (e–g). h) Representative raw time‐lapse signals from MRSA colony and CrtM mutant colony. White arrows indicate the interface between air and sample. Time‐lapse signals were fitted by Equation (1). Images were processed from raw data with dynamic range of 0–255 through ImageJ.
