Figure 3.

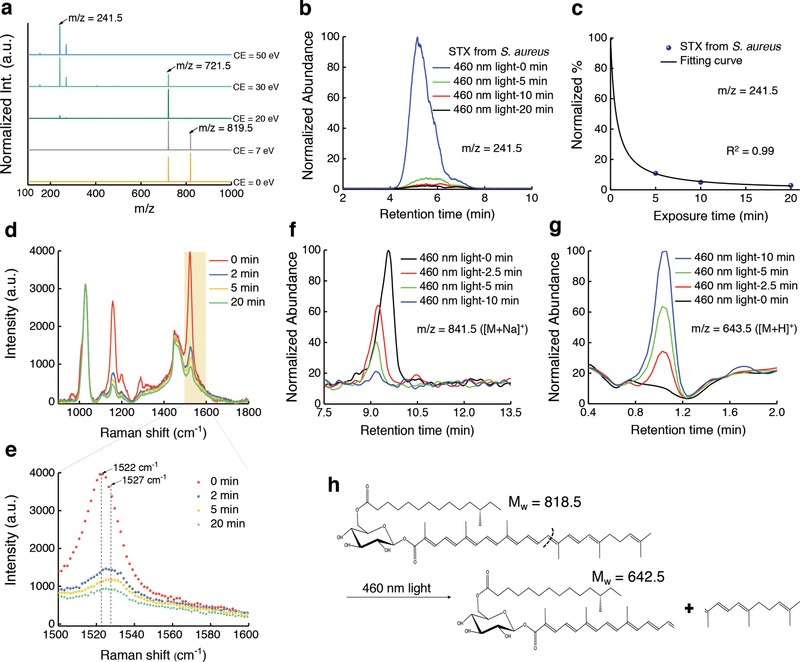
Mass spectrometry and Raman spectroscopy unveil the photochemistry of staphyloxanthin under 460 nm light exposure. a) MS spectra of crude STX extract at different collision energy (CE). Peaks of m/z = 819.5, 721.5, and 241.5 are highlighted by black arrows. b) HPLC chromatograms of STX extracted from concentrated MRSA over 460 nm light exposure at an intensity of 90 mW cm−2. c) The amount of STX calculated from (b). Quantification of STX is determined from the peak area of STX in HPLC chromatograms shown in (b). Data points are fitted by Equation (1). d) Raman spectra of crude STX (extracted from concentrated MRSA) under different 460 nm light doses. 460 nm light intensity: 200 mW cm−2. Raman excitation wavelength: 532 nm, acquisition time: 30 s. e) Zoomed‐in view of (d) in the Raman shift range from 1500 to 1600 cm−1, Raman shifts at 1522 and 1527 cm−1 are highlighted by black arrows and dashed lines. f,g) UPLC chromatograms of STX f) and one of its corresponding products g) over 460 nm light exposure. h) Tentative breakdown pathway of STX under 460 nm light irradiance.
