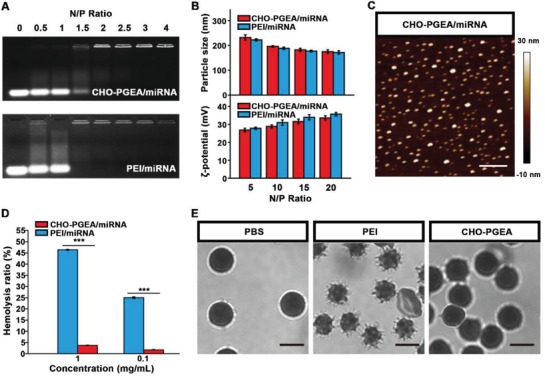
Figure 2.

A) Electrophoretic mobility retardation assay of polycation/miRNA complexes at various N/P ratios. B) Particle size and ζ‐potential of the polycation/miRNA complexes at various N/P ratios. C) AFM images of polycation/miRNA complexes at the typical N/P ratio of 10 (scale bar: 500 nm). D) Qualification of hemolysis ratio and E) images of red blood cells (RBCs) treated with PEI and CHO‐PGEA at the concentration of 1 mg mL−1 (scale bar: 5 µm), where PBS was used as the control. ***P < 0.001; Data are from 3 independent experiments.
