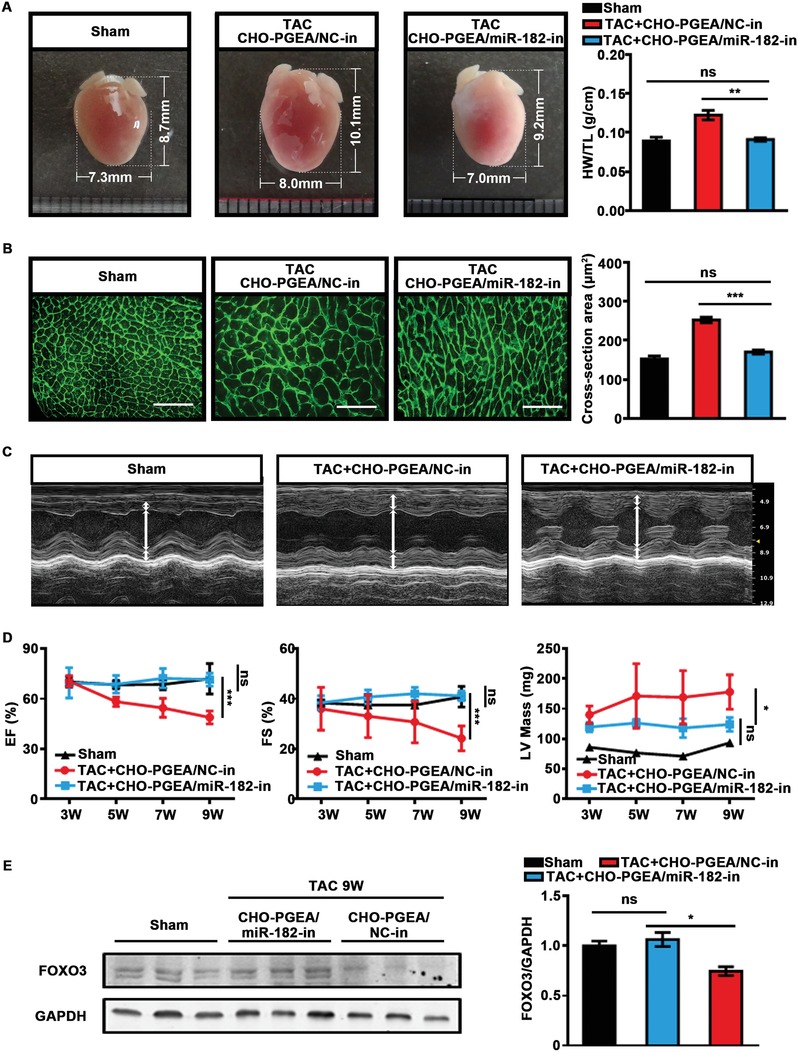
Figure 5.

CHO‐PGEA/miR‐182‐in complex prevents hypertrophy. A) Gross phenotypic pattern captured by digital camera and heart weight (HW)/tibia length (TL) ratio at the end of treatment. B) Images of wheat germ agglutinin (WGA) stained hearts and quantification of myocyte cross section areas (scale bar: 50 µm). C) Left ventricle (LV) M‐mode images and D) echocardiographic data of mice hearts administered with CHO‐PGEA/miRNA‐in complexes from the 3rd week to the 9th week after TAC surgery, including ejection fraction (EF), FS, and LV mass. E) FOXO3 protein levels in mice heart after TAC by WB. *P < 0.05, **P < 0.01, and ***P < 0.001 (n = 5 per group).
