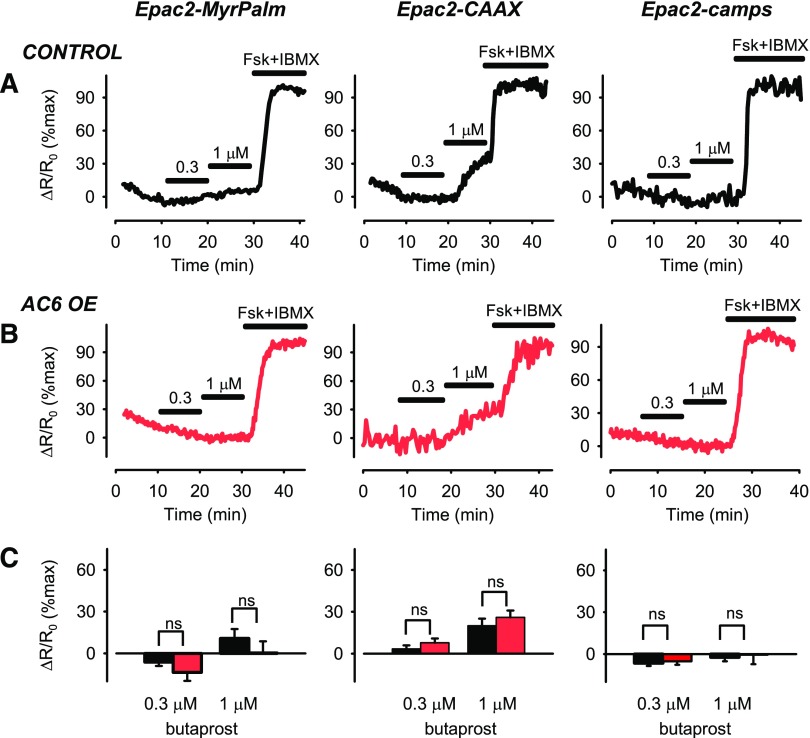
Fig. 2.
Changes in cAMP activity in different subcellular domains after EP2R stimulation. Representative time course of changes in magnitude of FRET response (ΔR/R0) detected by Epac2-MyrPalm, Epac2-CAAX, and Epac2-camps biosensors after activation of EP2Rs with 0.3 and 1 µM butaprost in (A) untreated human ASM cells (control) and (B) human ASM cells overexpressing (OE) AC6. Results are normalized to the magnitude of the maximal response produced by forskolin (FSK, 10 µM) and IBMX (100 µM) in the same cell. (C) Size of average FRET responses in control cells (black bars) and AC6 OE cells (red bars). AC6 OE did not significantly affect (P > 0.05, Student’s t test) responses detected by Epac2-MyrPalm (control, n/N = 13/8; AC6 OE, n/N = 8/5), Epac2-CAAX (control, n/N = 20/10; AC6 OE, n/N = 10/7), or Epac2-camps (control, n/8 = 13; AC6 OE, n/N = 11/6).

