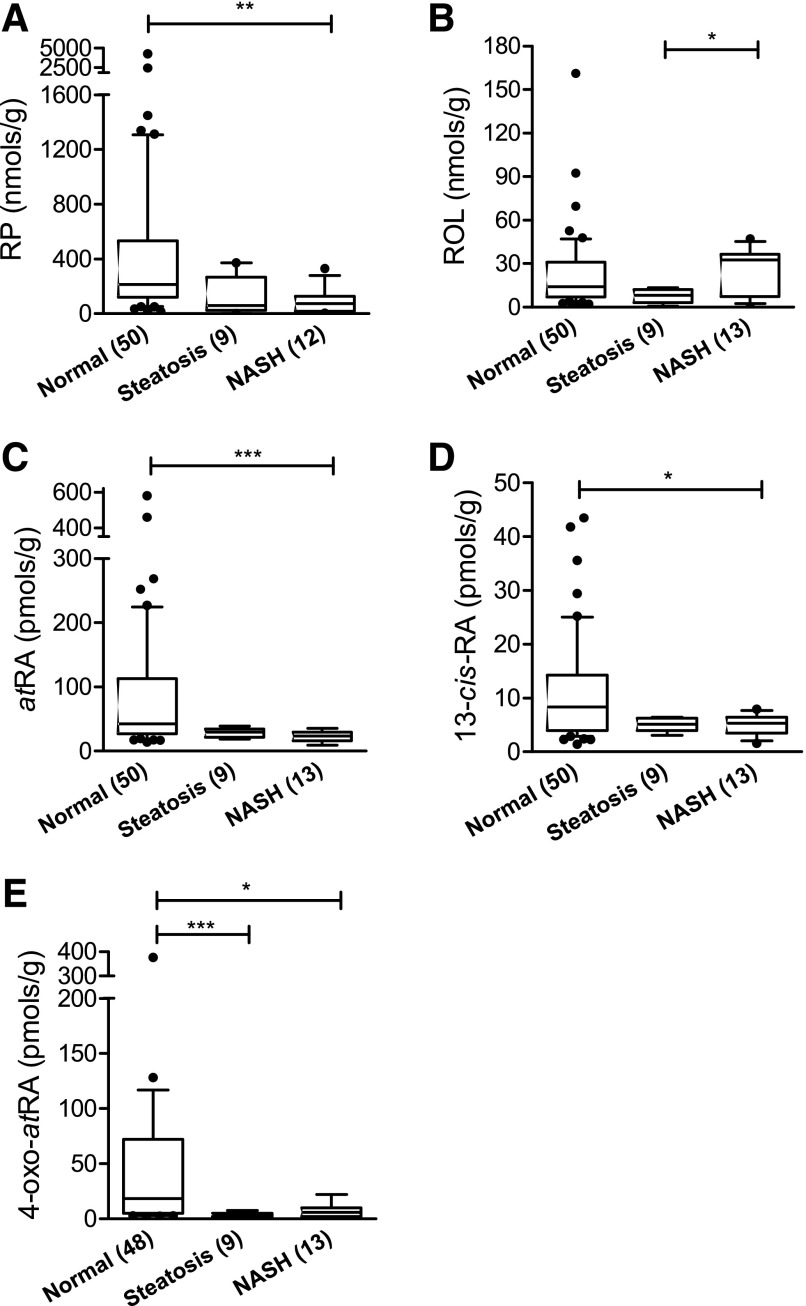
Fig. 6.
Box and whiskers plots of retinoid concentrations in a subset of normal human livers and NAFLD human liver samples. (A) Retinyl Palmitate, (B) Retinol, (C) all-trans-Retinoic acid, (D) 13-cis-retinoic acid, (E) 4-oxo-all-trans-Retinoic acid. The liver disease stage is shown in the x-axis. Significant differences between the three groups were tested with Kruskal-Wallis test followed by Dunn’s multiple comparison test; *P< 0.05; **P < 0.01; ***P < 0.001. In all panels, the box, horizontal line, and whiskers represent interquartile range (IQR), median and 10%–90% percentile, respectively. Numbers in brackets on the x-axis indicate the number of livers analyzed for each group. The RP concentration in one NASH liver sample was below LOD. Hence the RP concentration in this liver was excluded from the data. The median concentrations and ranges of each retinoid in the three groups are listed in Table 3.

