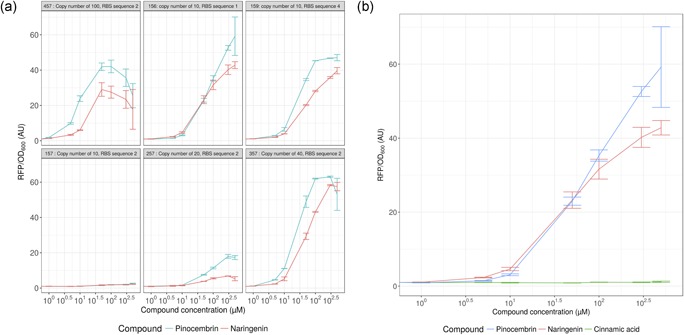
Figure 3.

Dose responses of different biosensor constructs. (a) Constructs 457, 156, 159, 157, 257, and 357 were cultivated for 24 hr in the presence of increasing concentrations of pinocembrin (blue) and naringenin (red) ranging from 1 to 500 µM. Error bars are based on the standard deviation of a minimum of biological triplicate. (B) Biosensor 156 was cultivated for 24 hr in the presence of increasing concentrations of pinocembrin (blue), naringenin (red), and cinnamic acid (green) ranging from 1 to 500 µM. Error bars are based on the standard deviation of a minimum of biological triplicate [Color figure can be viewed at wileyonlinelibrary.com]
