
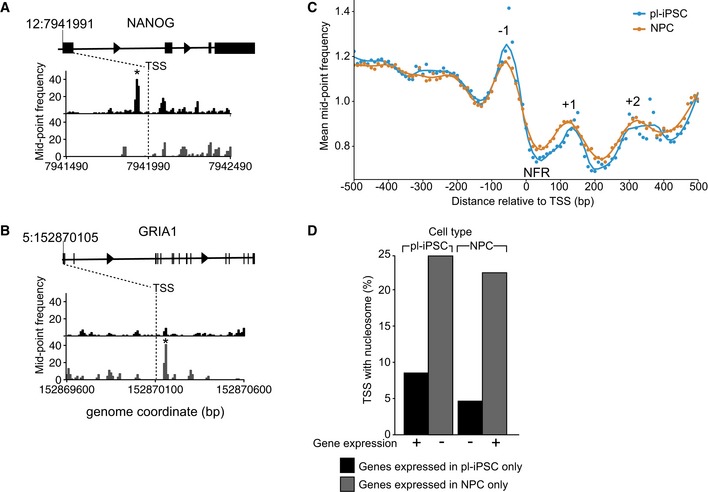
Figure 3. The relationship of positioned nucleosomes at the TSS and gene expression.
-
A, BNucleosome maps at and surrounding, the TSS region of the NANOG and GRIA1 genes in pl‐iPSC (upper, black) and in NPCs (lower, grey). The TSS is indicated by a dashed line at chr 12: 7,941,991 for NANOG and chr5: 152,870,105 for GRIA1. * indicates the position of a highly positioned nucleosome associated with the TSS of the active gene.
-
CGlobal frequency distribution of nucleosome distributions at TSS of protein‐coding genes. Alignment of nucleosome maps centred on TSS using the non‐redundant list of 66,047 mapped human protein‐coding gene TSS. The features corresponding to the nucleosome‐free region (NFR) and −1 to +2 nucleosomes are marked.
-
DGenome‐wide positioning of nucleosomes within ± 300 bp of a TSS of an active gene. The number of nucleosomes observed is plotted for both pl‐iPSC and NPC types for gene sets selected either as uniquely expressed in pl‐iPSC (n = 3,833) or NPC (n = 2,082). If positioned nucleosomes are a strong predictor of gene activity, high numbers of nucleosomes would be expected for pluripotent‐specific genes in pl‐iPSC, but not NPC stages, and for NPC‐specific genes in NPC, but not pl‐iPSC stages. No correlation between gene activity and positioned nucleosomes was observed.