-
A, B
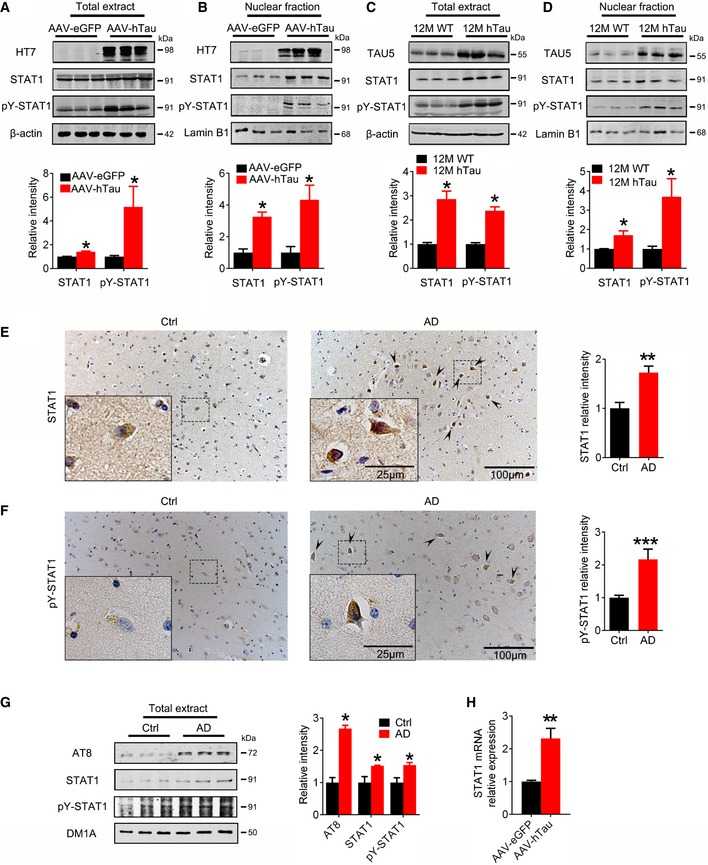
AAV‐hTau‐eGFP (AAV‐hTau) or the empty vector AAV‐eGFP (1.13 × 10¹³ v.g./ml) was stereotaxically injected into hippocampal CA3 of 3‐month‐old C57 mice. After 1 month, the increased levels of STAT1 and pY‐STAT1 in hippocampal total extracts and the nuclear fraction were detected in hTau group by Western blotting (n = 6, Mann–Whitney test).
-
C, D
The increased STAT1 and pY‐STAT1 in hippocampal total extracts and the nuclear fraction of 12‐month‐old hTau transgenic mice were measured by Western blotting (n = 4, Mann–Whitney test).
-
E, F
The representative images of STAT1 and pY‐STAT1 in the brain of AD patients probed by co‐immunohistochemical staining and quantitative analysis (hematoxylin stains nuclei, purple; DAB stains the target proteins, brown; n = 5–6 slices). Arrowheads indicated typical nuclear staining of STAT1/pY‐STAT1.
-
G
The increased AT8 (pS202/pT205), STAT1, and pY‐STAT1 in cortex total extracts of AD patients were measured by Western blotting (n = 3, Student's t‐test).
-
H
STAT1 mRNA was analyzed by qRT‐PCR in AAV‐hTau‐ or AAV‐eGFP infected hippocampal tissues (n = 6, Mann–Whitney test).
Data information: Data were presented as mean ± SD. *
P < 0.05; **
P < 0.01; ***
P < 0.001 vs eGFP, wt, or Ctrl.
Source data are available online for this figure.

