-
A–F
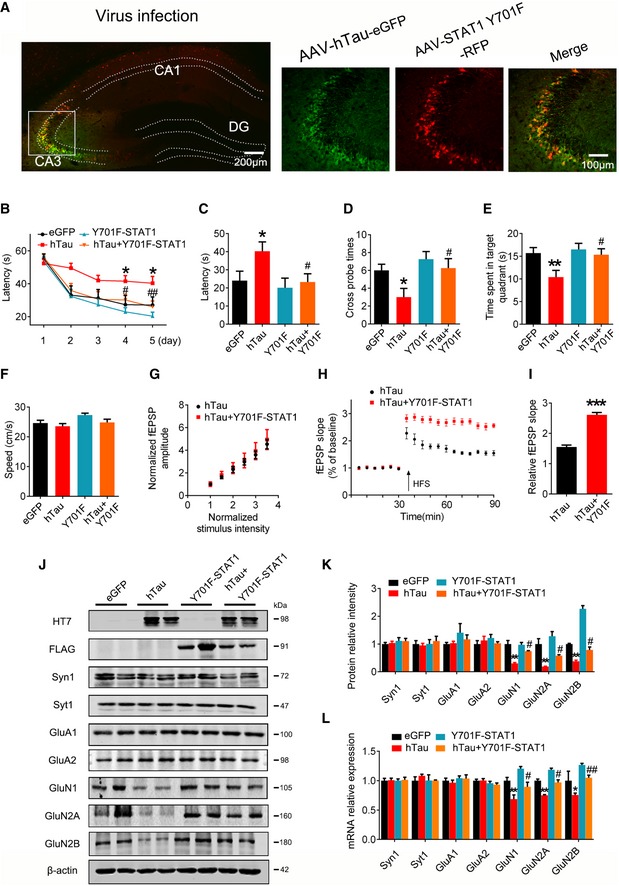
AAV‐eGFP (eGFP) or AAV‐hTau‐eGFP (hTau) (1.13 × 10¹³ v.g./ml) or AAV‐Y701F‐STAT1 (5 × 10¹² v.g./ml) or AAV‐Y701F‐STAT1 (5 × 10¹² v.g./ml) plus hTau was stereotaxically injected into hippocampal CA3 of 3‐month‐old C57 mice. After 1 month, learning and memory were detected by MWM test. (A) The representative fluorescence image confirms expression of AAV‐hTau and AAV‐Y701F‐STAT1. Scale bar, 200 μm or 100 μm for the enlarged. (B) Overexpression of Y701F‐STAT1 mitigated hTau‐induced spatial learning deficits shown by the decreased escape latency during water maze training (n = 7–10 each group). (C‐E) Overexpression of Y701F‐STAT1 mitigated hTau‐induced spatial memory impairment shown by the decreased latency to reach the platform (C), the increased crossing time in the platform site (D), and time spent in the target quadrant (E) measured at day 6 by removing the platform (n = 7–10 each group). (F) Expression of Y701F‐STAT1 did not change the swimming speed of the mice in water maze task (n = 7–10 each group).
-
G–I
Simultaneous expression of Y701F‐STAT1 did not induce any further change on basal synaptic transmission (I/O curve) compared with expression of hTau alone, recorded in hippocampal CA3 (G). LTP magnitude was calculated as the average (normalized to baseline) of the responses recorded 40–60 min after conditioning stimulation (I) (n = 5 slices from 4 mice for each group).
-
J–L
Simultaneous expression of Y701F‐STAT1 rescued the hTau‐induced suppression of NMDARs protein (J, K) and mRNA (L) expression measured by Western blotting and qRT–PCR in hippocampal CA3 of C57 mice (n = 4).
Data information: Data were presented as mean ± SEM for (B‐F) and mean ± SD for others (two‐way repeated measures analysis of variance (ANOVA) followed by Bonferroni's post hoc test for B, two‐way analysis of variance (ANOVA) followed by Bonferroni's post hoc test for others). *
P < 0.05; **
P < 0.01; ***
P < 0.001 vs eGFP or hTau;
#
P < 0.05;
##
P < 0.01 vs hTau.
Source data are available online for this figure.

