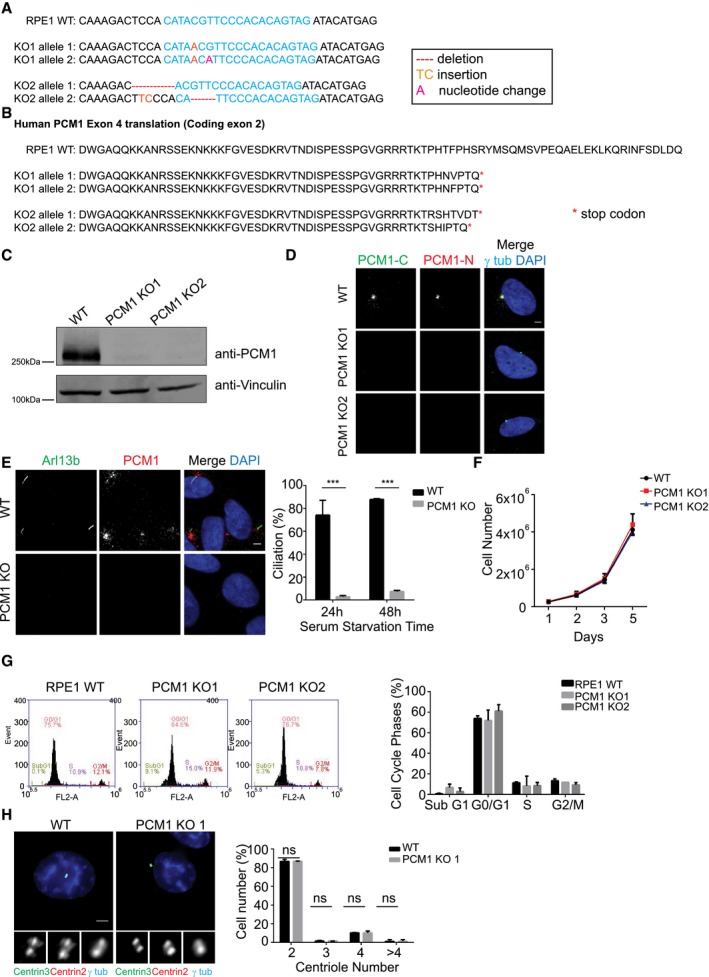
RPE1 PCM1 KO clones are all compound heterozygotes with mutations that lead to early stop codons. 1,000 bp region around the gRNA‐target site was PCR‐amplified and cloned. Sequencing of five different clones for each line identified one 1‐nt insertion on one allele and one‐nt insertion and one‐nucleotide change on the other for line 1, 7‐nt deletion on one allele and 4‐nt deletion and 2‐nt insertion on the other for line 2.
Translation products of the gRNA‐targeting exon (protein‐coding exon 2) in RPE1 PCM1 KO clones.
Immunoblot analysis of whole‐cell lysates from control cells and two RPE1 PCM1 KO clones with PCM1 antibody targeting N‐terminal 1–254 amino acids.
Immunofluorescence analysis of control and RPE1 PCM1 KO clones. Cells were fixed and stained for centrosomes with anti‐γ‐tubulin antibody and PCM1 with PCM1‐N antibody and PCM1‐C antibody. Scale bar, 3 μm.
Effect of satellite loss on cilium formation. Control and RPE1 PCM1 KO cells were serum‐starved for the indicated times, and percentage of ciliated cells was determined by staining for acetylated tubulin, Arl13b, and DAPI. Results shown are the mean of three independent experiments ± SD (500 cells/experiment, ***P < 0.001, t‐test).
Effects of satellite loss on cell proliferation. 105 cells were plated and counted at 1, 2, 3, and 5 days. Data points show mean ± SD of three independent experiments. There was no significant difference between control and RPE1 PCM1 KO cells at any time point.
Effect of satellite loss on percentage of cells in different cell cycle phases. Flow cytometry analysis of control or RPE1 PCM1 KO cells. Data points show mean ± SD of three independent experiments.
Effect of satellite loss on centriole duplication. Asynchronous control and RPE1 PCM1 KO cells were stained with staining for centrin2, centrin3, and gamma‐tubulin and DAPI. Quantification results shown are the mean of two independent experiments ± SD (100 cells/experiment, t‐test). Scale bar, 4 μm.

