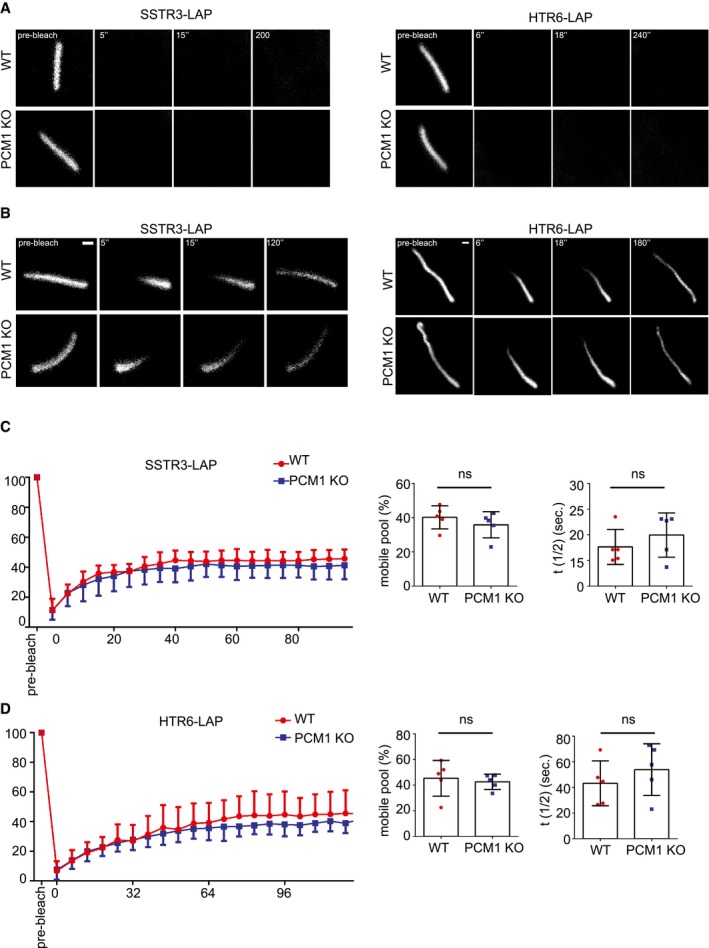
Figure EV4. FRAP experiments in IMCD3 control and PCM1 KO cells expressing SSTR3‐LAP and HTR6‐LAP .

-
A–DRepresentative still images of FRAP in the (A) whole cilium and (B) half‐cilium in IMCD3 24 h after serum starvation of IMCD3 cells stably expressing SSTR3‐LAP and HTR6‐LAP. Representative examples of different time points from each FRAP experiments are shown. Scale bar, 1 μm. (C, D) Quantification of half‐cilium FRAP experiments for control and PCM1 KO cells expressing (C) SSTR3‐LAP and (D) HTR6‐LAP. Kinetics of average (± SD) fluorescence recovery of proteins photobleached in the half‐cilium, half‐time of recovery t1/2, and percentage of recovery were quantified (n = 5 cells).
