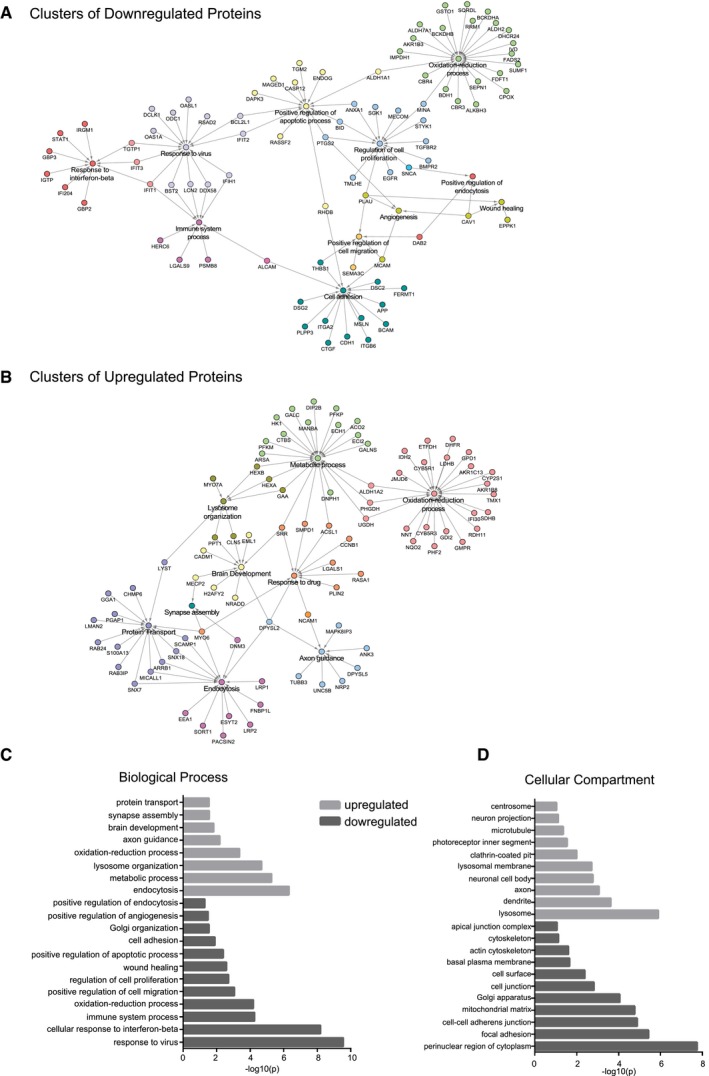
Figure EV5. Interaction network and GO analysis of the upregulated and downregulated proteins in IMCD3 PCM1 KO cells.

-
A, BInteraction network analysis for (A) downregulated and (B) upregulated proteins identified by GO‐enrichment analysis revealed pathways enriched or depleted in satellite‐less cells.
-
C, DGO‐enrichment analysis for upregulated and downregulated proteins in satellite‐less cells in (C) biological function and (D) cellular compartment categories.
