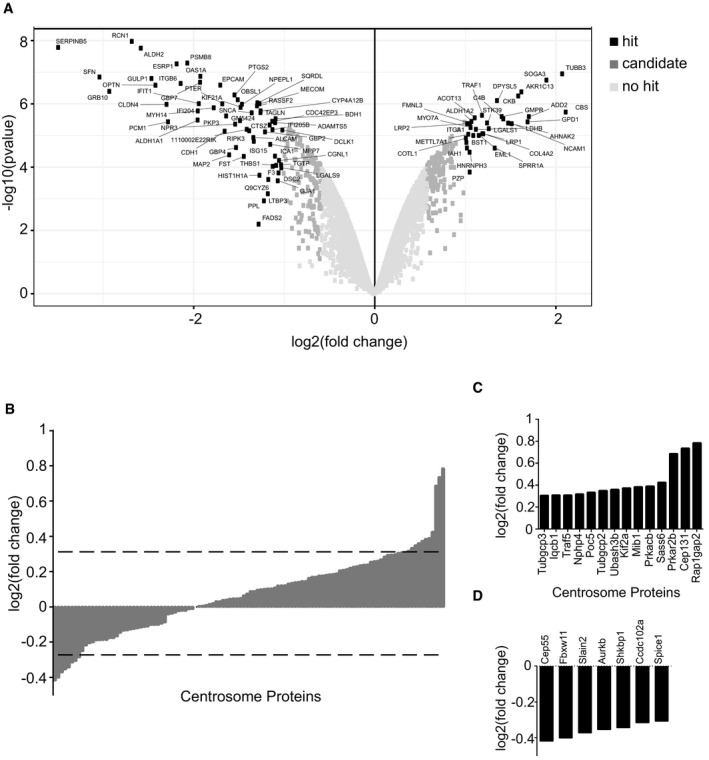
Figure 8. Loss of satellites changes the global proteome.

- Volcano plots illustrating that 591 proteins show a significant change in abundance. Data were derived from mass spectrometry analysis of three biological replicates of control and IMCD3 PCM1 KO cells. The x‐axis corresponds to the log2 fold change value, and the y‐axis displays the −log10 P‐value. Proteins were classified into hits (indicated with black circles) if the FDR is smaller than 0.05 and a fold change of at least twofold is observed. Proteins were classified into candidates (indicated with medium gray circles) if the FDR is smaller than 0.2 and a fold change of at least 1.5‐fold is observed.
- Comparison of the centrosome proteome with the IMCD3 PCM1 KO global proteome. 112 centrosome proteins identified in the global proteome (x‐axis) were plotted against their log2‐transformed ratios of fold changes (y‐axis) between IMCD3 PCM1 KO and control samples. Dashed line indicates the threshold we determined for the significantly upregulated and downregulated proteins represented in (C and D).
- Significantly upregulated centrosome proteins (log2 > 0.3).
- Significantly downregulated centrosome proteins (log2 < −0.3).
