
Figure 2. Diversity of filamentous phage genomes.
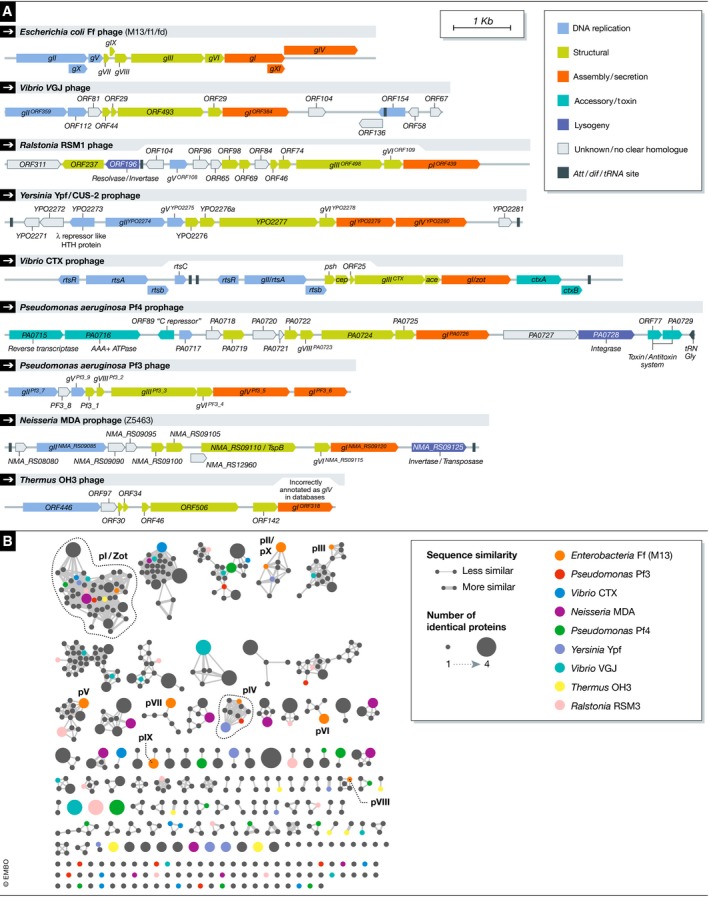
(A) Schematic representation of filamentous phage genomes: for each gene identified in the genome, the putative function is noted either based on experimental evidence, inferred from sequence homology, or based on conserved domain predictions. Scale bare represents genome size in nucleotide base pairs. (B) Protein sequence similarity network plot of all predicted open‐reading frames from 56 filamentous phage genomes. The great proportion of orphan proteins in this plot demonstrates that at the protein sequence level, there is a very high degree of diversity in filamentous phages. Each circle node represents a sequence, and each connecting line represents a BLAST score better than 1e‐5. Identical proteins are collapsed into one circle with the size representing the number of proteins denoted. Representative species are coloured as shown, and the identity of the Ff proteins is annotated in the plot.