-
A
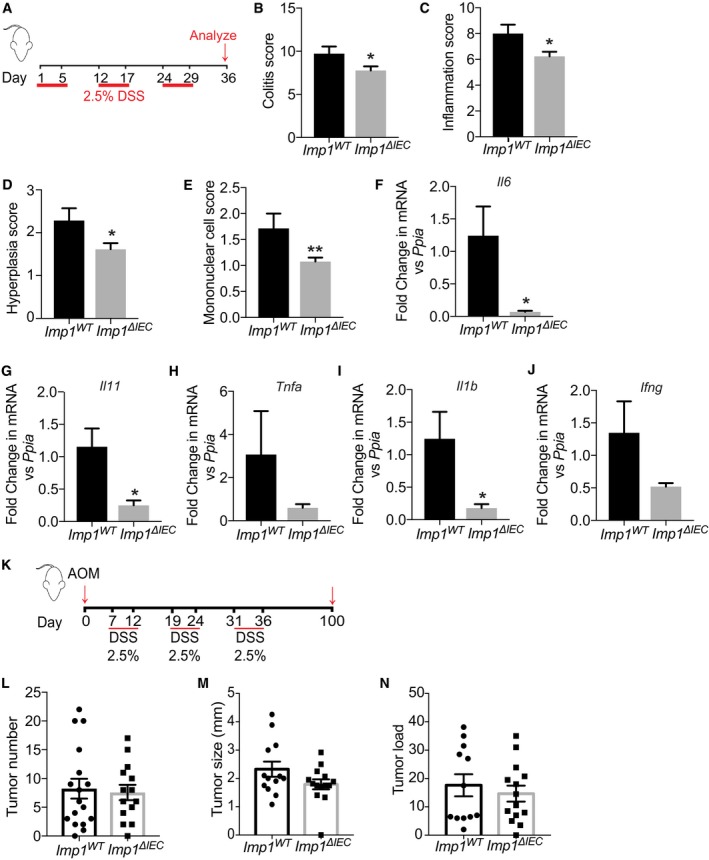
Mice were given three cycles of 2.5% dextran sodium sulfate (DSS) in drinking water for 5 days followed by a week of recovery. Mice were analyzed at day 36.
-
B
Imp1
ΔIEC mice show significantly less total colitis (7.769 ± 0.4824, n = 13; scored blinded by a pathologist) as compared to Imp1
WT mice (9.714 ± 0.8371, n = 7; P‐value = 0.0435).
-
C
Imp1
ΔIEC mice show significantly less hyperplasia (1.615 ± 0.1404, n = 13) as compared to Imp1
WT mice (2.286 ± 0.2857, n = 7; P‐value = 0.0287).
-
D
Imp1
ΔIEC mice show significantly less inflammation score (6.231 ± 0.3608, n = 13) as compared to Imp1
WT mice (8 ± 0.6901, n = 7; P‐value = 0.0213).
-
E
Imp1
ΔIEC mice show significantly less mononuclear cell infiltration (1.077 ± 0.076, n = 13) as compared to Imp1
WT mice (1.714 ± 0.2857, n = 7; P‐value = 0.0128).
-
F–J
qPCR data showing cytokine expression following chronic DSS treatment in colon epithelium of Imp1
WT (n = 4) and Imp1
ΔIEC mice (n = 6) at day 36 (P‐values are as follows: 0.0109 for Il6, 0.0107 for Il11, and 0.0240 for Il1b).
-
K
Tumors were induced in Imp1
WT and Imp1
ΔIEC mice using the azoxymethane/dextran sodium sulfate (AOM/DSS) model.
-
L
Tumors were evaluated 14 weeks after the initial AOM injection. Imp1
WT (8.235 ± 1.723, n = 17, 5F/12M) and Imp1
ΔIEC (7.571 ± 1.337, n = 14, 7F/7M) mice do not show any significant difference in tumor initiation.
-
M, N
Imp1
WT and Imp1
ΔIEC mice do not show any significant differences in tumor size or load. Imp1
WT
n = 17, 5F/12M; Imp1
ΔIEC
n = 12, 7F/7M.
Data information: Data are expressed as mean ± SEM. *
‐test.

