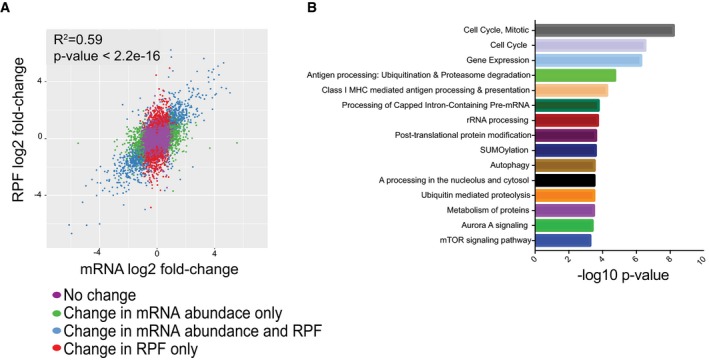
Figure 3. IMP1 deletion increased level of proteins in the autophagy pathway.

- Scatterplot of differential expression between SW480 cells with and without IMP1 deletion. The log2 fold change between ribosome‐bound RNAs (ribosome protected fragments, or RPF) and total mRNA is plotted. The plot indicates that IMP1 loss is associated with changes in mRNA abundance and RPF.
- Pathway analysis of genes with differential translational efficiencies between SW480 cells with and without IMP1 deletion to define signaling/effector pathways that are enriched with IMP1 deletion.
