-
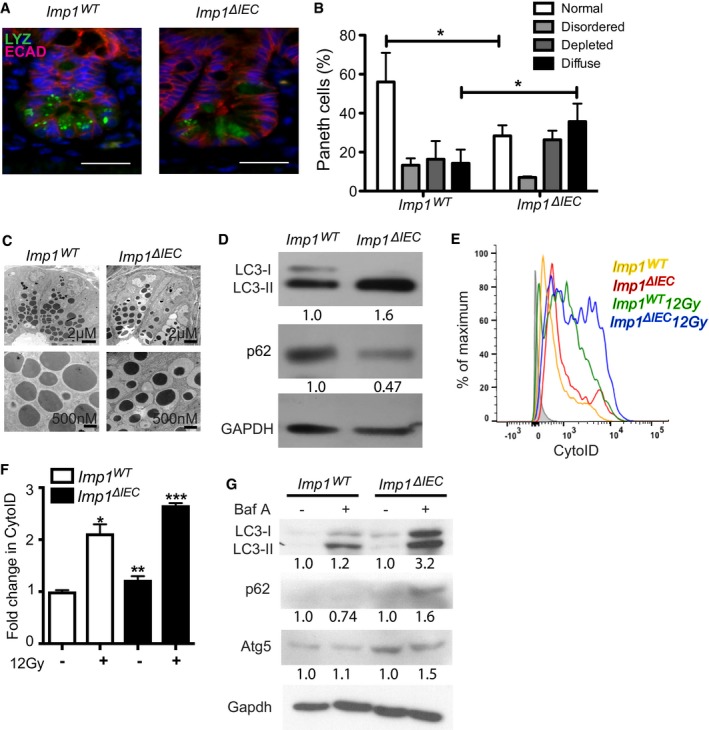
A
Paneth cells from Imp1
WT and Imp1
ΔIEC mice were evaluated histologically using immunofluorescence (IF) for lysozyme (LYZ). E‐cadherin (ECAD) staining was used to demarcate individual epithelial cells. Note presence of diffuse lysozyme staining in Imp1
ΔIEC mice. Scale bar = 25 μm.
-
B
Published lysozyme scoring was utilized to evaluate specific Paneth cell phenotypes. Imp1
ΔIEC mice exhibit a significant shift from normal to diffuse lysozyme phenotype (n = 4 mice per genotype, blinded scoring; P‐value = 0.0116).
-
C
Transmission electron microscopy revealed an abundance of smaller, electron dense granules in Imp1
ΔIEC mice compared to control.
-
D
Western blot for cleaved LC3 and p62 in colon epithelial cells from Imp1
WT and Imp1
ΔIEC mice. Blots are representative of three independent experiments with densitometry measurements listed below each band.
-
E, F
Live cell staining of autophagic structures with the cationic amphiphilic tracer dye CytoID indicated a significant increase in autophagic vesicle content in crypt epithelial cells from Imp1
ΔIEC mice (n = 8) compared to Imp1
WT mice (n = 7) via flow cytometry (representative histogram plot in E).
-
G
Crypt enteroids from control and Imp1
ΔIEC mice treated with Bafilomycin A1 for 12 h. Enteroids were washed with cold PBS and harvested in protein lysis buffer prior to immunoblot. Blot is representative of two independent experiments, representing independent enteroid lines. Densitometry measurements are listed below each band.
Data information: All data are expressed as mean ± SEM. *
< 0.001; by ordinary one‐way ANOVA with Bonferroni's multiple comparison test (F) or unpaired two‐tailed
‐test (B).

