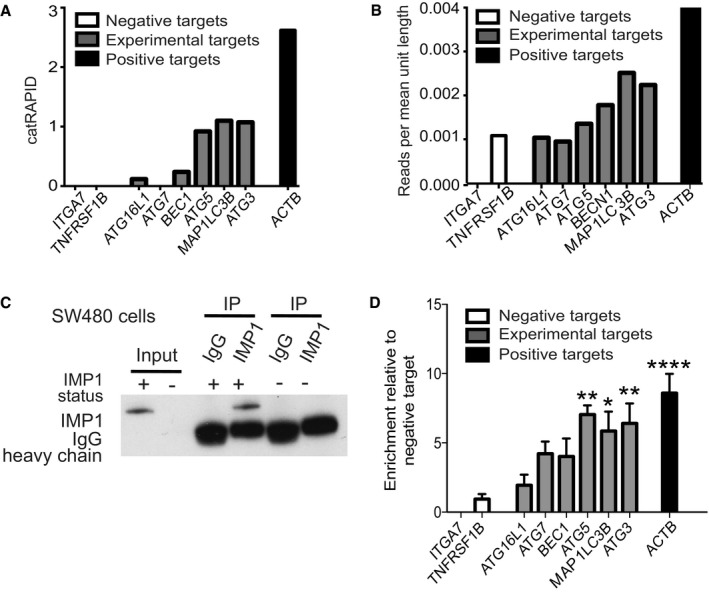
catRAPID transcript score. For each predicted transcript, we measured the IMP1 interaction propensity with respect to the negative control IgG. Negative targets (ITGA7 and TNFRSF1B) were also evaluated.
We retrieved CLIP scores from published eCLIP data and compared against the same set of autophagy‐related transcripts analyzed in (A) and found a strong correlation between catRAPID scores and eCLIP data (r = 0.9838465 Pearson correlation coefficient). CLIP data scores were calculated as total number of reads corresponding to the transcript divided by the length of the different isoforms.
We evaluated binding of endogenous IMP1 to autophagy transcripts using RIP assays in SW480 cells (n = 3). Specific enrichment of IMP1 was confirmed by IP with either IMP1 or control IgG antibodies followed by western blot for IMP1. We used cells with IMP1 deletion as negative control.
Enrichment of target transcripts over control is represented relative to negative target, TNFRSF1B. ACTB is the positive control (P‐value < 0.0001; n = 3 independent experiments). The targets that are significant are ATG5 (P‐value = 0.0013), MAP1LC3B (P‐value = 0.0148), and ATG3 (P‐value = 0.0052).
Data information: All data are expressed as mean ± SEM. *
P < 0.05; **
P < 0.01, ****
P < 0.0001; by ordinary one‐way ANOVA test or unpaired two‐tailed
t‐test.

