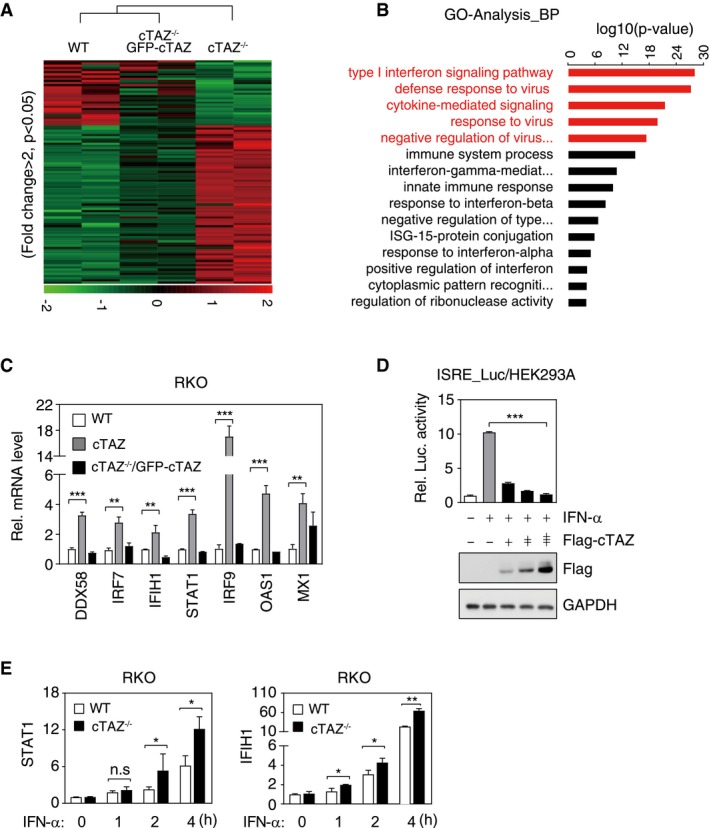
Figure 2. cTAZ directly represses JAK‐STAT signaling.

- Cluster analysis of RNA expression of WT, cTAZ−/−, and cTAZ−/−/GFP‐cTAZ put‐back RKO cells. Genes down‐ and up‐regulated more than twofold (P < 0.05) in cTAZ KO cells were included in cluster analysis. Green and red indicate down‐ and up‐regulated genes, respectively.
- Gene ontology (GO) analysis identified differentially regulated pathway by cTAZ.
- cTAZ suppressed expression of ISGs. RNA levels of selected ISGs in WT, cTAZ−/−, and cTAZ−/−/GFP‐cTAZ RKO cells were quantified by qPCR. Error bars indicate SD, n = 3. **P < 0.01; ***P < 0.001; Student's t‐test.
- cTAZ repressed 5×ISRE‐luciferase activity induced by IFN‐α. HEK293A cells were transfected with 5×ISRE‐luciferase reporter along with the indicated plasmids, treated with or without IFN‐α (50 ng/ml) for 12 h. The expression of ectopic gene was determined by IB. Error bars indicate SD, n = 3. ***P < 0.001; one‐way ANOVA test was used for statistical analysis.
- Knockout of cTAZ promoted ISG expression in the presence of IFN‐α. WT and cTAZ −/− RKO cells were treated with or without of IFN‐α (50 ng/ml) for indicated time, and expression of selected genes was quantified by qPCR. WT or cTAZ −/− group was normalized by basal level, respectively. Error bars indicate SD, n = 3. *P < 0.05; **P < 0.01; Student's t‐test.
Source data are available online for this figure.
