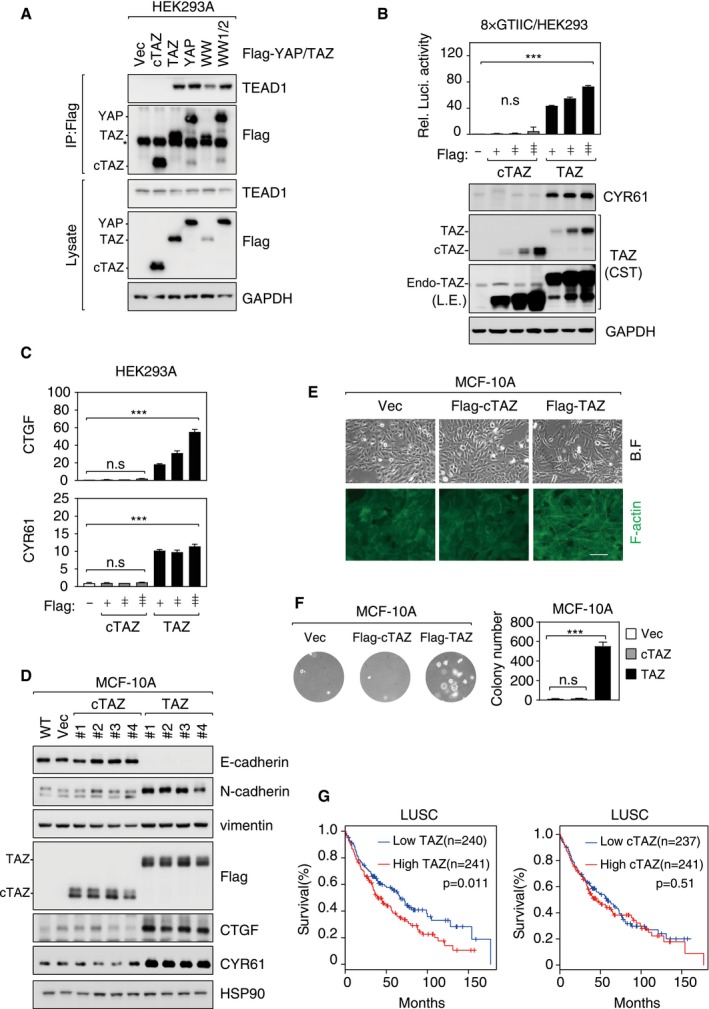
Figure EV3. cTAZ had no TEAD‐dependent transcriptional activity.

- cTAZ did not interact with TEADs. HEK293A cells were transfected with Flag‐tagged cTAZ, TAZ, YAP, WW‐mutated TAZ (WW), or WW1/2‐mutated YAP (WW1/2), and cells were lysed 24 h later for IP using Flag antibody. The asterisk indicates position of IgG.
- cTAZ could not activate TEAD reporter. HEK293A cells were transfected with 8×GTIIC‐luciferase reporter along with cTAZ or TAZ plasmid. Luciferase activity was measured. The expression levels of TAZ, cTAZ, and CYR61 (a TAZ targeting gene) were determined by IB. Error bars indicate SD, n = 3. ***P < 0.001; Student's t‐test.
- cTAZ could not induce expression of YAP/TAZ target genes. Cells were transfected as in (B). Endogenous CTGF and CYR61 mRNA levels were determined by qPCR. Error bars indicate SD, n = 3. ***P < 0.001; Student's t‐test.
- Overexpression of cTAZ could not induce EMT. cTAZ‐ or TAZ‐overexpressing MCF‐10A cell lines were established. Expression of TAZ target genes (CYR61 and CTGF) and EMT markers (epithelial marker: E‐cadherin; mesenchymal markers: N‐cadherin and vimentin) was assessed by IB.
- cTAZ could not induce EMT phenotype. MCF‐10A cells (also used in D) expressing cTAZ remained in an organized monolayer, and actin cytoskeleton was similar to that of wild‐type cells. On the other hand, full‐length TAZ induced cell morphological change and formation of strong actin fibers. Filamentous actin (F‐actin) was visualized by FITC‐conjugated phalloidin. Scale bar, 100 μm.
- cTAZ could not induce anchorage‐independent growth. MCF10A cells (also used in D) were seeded into soft agar; after 3 weeks, colony formation was determined. Error bars indicate SD, n = 3. ***P < 0.001; Student's t‐test.
- The expression of TAZ, but not cTAZ, served as a prognostic marker. Lung squamous cell carcinoma (LUSC) mRNA expression data were collected from TCGA database, and the relationship between TAZ (or cTAZ) expression and patient overall survival was analyzed using GEPIA application. The P‐values are derived by using the Mantel–Cox test.
Source data are available online for this figure.
