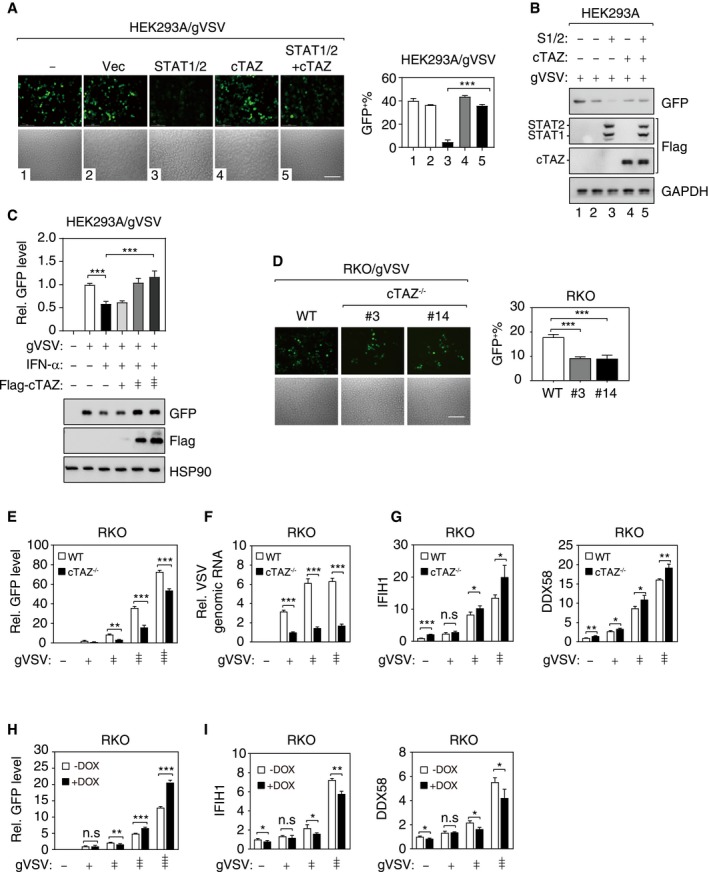
Figure 4. cTAZ negatively regulates cellular antiviral response.

- cTAZ repressed the antiviral activity of ectopic STAT1/2. HEK293A cells were transfected with indicated plasmids, infected with gVSV (MOI = 0.01) for 12 h, fixed, and subjected to microscopy (Left). Viral infection and replication were marked by green fluorescence. Scale bar, 100 μm. (Right) Quantification of GFP‐positive cells. About 300 cells (from three different fields) were analyzed. Error bars indicate SD. **P < 0.01; ***P < 0.001; Student's t‐test.
- cTAZ and STAT1/2 expression levels of cells used in (A).
- cTAZ effectively repressed antiviral activity of IFN‐α. Transfection and infection were performed as in (A). Top: GFP intensity of cell lysates was measured by a fluorometer. Bottom: Viral GFP and ectopic cTAZ protein levels were detected by IB.
- Depletion of cTAZ repressed viral replication. RKO cell lines (WT and two independent cTAZ −/− clones) were infected with gVSV (MOI = 0.1) for 12 h. Scale bar, 100 μm. The ratio of GFP‐positive cells were calculated as in (A). About 300 cells (from three different fields) were analyzed. Error bars indicate SD. ***P < 0.001; Student's t‐test.
- Depletion of cTAZ repressed viral replication. Cells were treated as in (D), and GFP intensity of cell lysates was measured. Error bars indicate SD, n = 3. **P < 0.01; ***P < 0.001; Student's t‐test.
- Depletion of cTAZ repressed viral replication. Cells were treated as in (D), and the viral genomic RNA was quantified by qPCR (normalized to human GAPDH). Error bars indicate SD, n = 3. ***P < 0.001; Student's t‐test.
- cTAZ deficiency enhanced ISG expression. Cells were treated as in (E), and expression of IFIH1 and DDX58 was assessed by qPCR. Error bars indicate SD, n = 3. *P < 0.05; **P < 0.01; ***P < 0.001; Student's t‐test.
- Overexpression of cTAZ promotes virus infection. DOX‐inducible cTAZ‐overexpressing RKO cell lines were pre‐treated with DOX for 48 h (1 μg/ml). gVSV infection and GFP fluorescence intensity quantification were performed as in (D). Error bars indicate SD, n = 3. **P < 0.01; ***P < 0.001; Student's t‐test.
- Overexpression of cTAZ repressed ISG expression. Cells were treated as in (H), and expression of IFIH1 and DDX58 was assessed by qPCR. Error bars indicate SD, n = 3. *P < 0.05; **P < 0.01; Student's t‐test.
Source data are available online for this figure.
